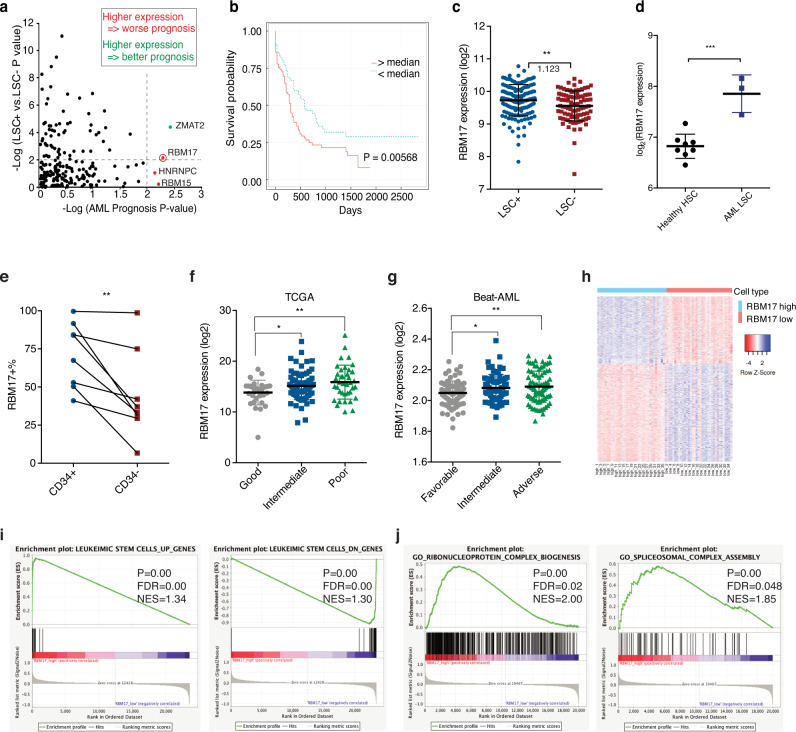
Fig. 1. Heightened expression of RBM17 correlates with poor prognosis in human AML patients.
a –log10 p-value (two-tailed Student’s t test) of each mRNA splicing factor expression in LSC-enriched vs LSC-depleted subsets from 78 AML patients (y axis) and their correlation (-log10 p-value) (log-rank test) with AML patients’ overall survival (x axis). b Kaplan–Meier curves showing outcomes of AML patients from the TCGA with above (n = 124) vs below (n = 155) median expression of RBM17. (P = 0.00568, log-rank test). c RBM17 transcript level in LSC-enriched (n = 138) vs LSC-depleted (n = 89) subsets from 78 AML patient samples (GSE76008). Average fold change of RBM17 expression in LSC-enriched over LSC-depleted subsets is indicated in the figure. Data are presented as mean ± SD, two-tailed Student’s t test. d Gene expression data (GSE35008) from sorted AML bone marrow samples were compared with data from healthy controls and revealed significantly increased RBM17 expression in AML LT-HSCs (Lin–CD34 + CD38–CD90 + , AML with normal karyotype, n = 3) compared with healthy control (n = 4). Data shown as mean ± SD, two-tailed Student’s t test. e Intracellular flow cytometric measurements of RBM17 protein level in the primitive CD34+ subset vs the committed CD34- subsets from 8 primary AML samples. P = 0.0092, P value was calculated using paired t-test, two-tailed. f Expression of RBM17 in 152 AML specimens and each molecular genetic risk group from the TCGA-LAML cohort (Good: n = 38; Intermediate: n = 76; Poor: n = 38). Data are presented as mean ± SD, two-tailed Student’s t test, P(Good vs Intermediate) = 0.0196, P(Good vs Poor)=0.0051. g Expression of RBM17 in 236 AML specimens and each molecular genetic risk group from Beat AML cohort (Favorable: n = 85, Intermediate: n = 68, Adverse: n = 83). Data are presented as mean ± SD, two-tailed Student’s t test, P(Favorable vs Intermediate) = 0.0188, P(Favorable vs Adverse)=0.0041. h A heatmap showing the expression of differentially expressed transcripts identified from RBM17-high AML cases versus RBM17-low AML cases. i, j Gene set enrichment analysis (GESA) of the gene signature of high-RBM17 AML cases compared with previously published i LSC signatures and j ribonucleoprotein complex biogenesis and spliceosomal complex assembly pathways. The significance of NES was calculated using Kolmogorov–Smirnov statistics. *P < 0.05, **P < 0.01, ***P < 0.001. Source data are provided as a Source Data file.

