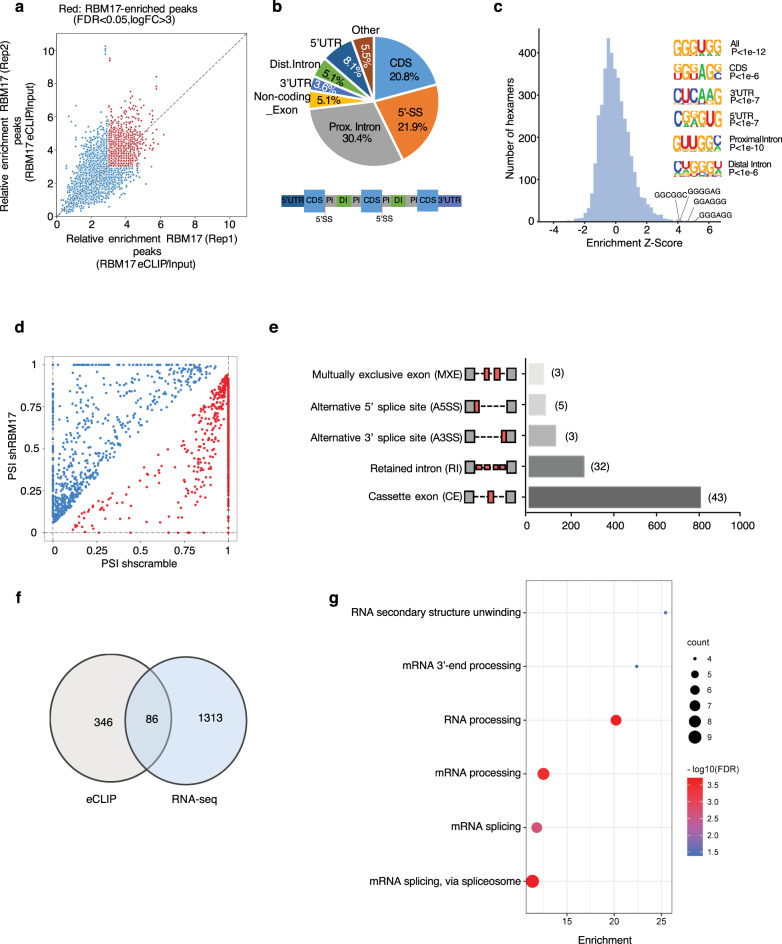
Fig. 3. Identification of RNA targets of and alternative splicing variants enforced by RBM17 in AML.
a eCLIP-seq analysis of RBM17 binding sites in K562 cells. Input-normalized peak signals are shown as log2 fold change. Red points indicate eCLIP-enriched RBM17 peaks (FDR < 0.05 and log2 (FC) > 3) in biological replicates. b Significantly enriched reproducible binding sites or RBM17 across the transcriptome. c Hexamer enrichment for RBM17 binding peaks in K562 cells based on eCLIP-seq. The top 4 enriched motifs are shown on the x axis. Insert shows enriched motifs for different genomic regions. d Scatterplot of splicing events promoted (blue circles) and repressed (red circles) by RBM17 knockdown (shRBM17) in K562 cells compared to control shscramble with a cutoff FDR < 0.1 and ΔPSI > 0.05. Splicing change is quantified using ΔPSI (percent spliced in). e Quantification of types of AS events affected by RBM17, as revealed by analysis of RNA-seq data. AS events are labeled as cassette exon (CE), retained intron (RI), alternative 3’ splice site (A3SS), alternative 5’ splice site (A5SS) and mutually exclusive exon (MXE). Number of splicing events directly bound by RBM17 is indicated beside the bar of each splicing type. f Overlay of transcripts between RBM17 eCLIP-seq analysis and RNA-seq splicing analysis. g GO enrichment analysis of terms enriched in splicing events directly bound by RBM17.

