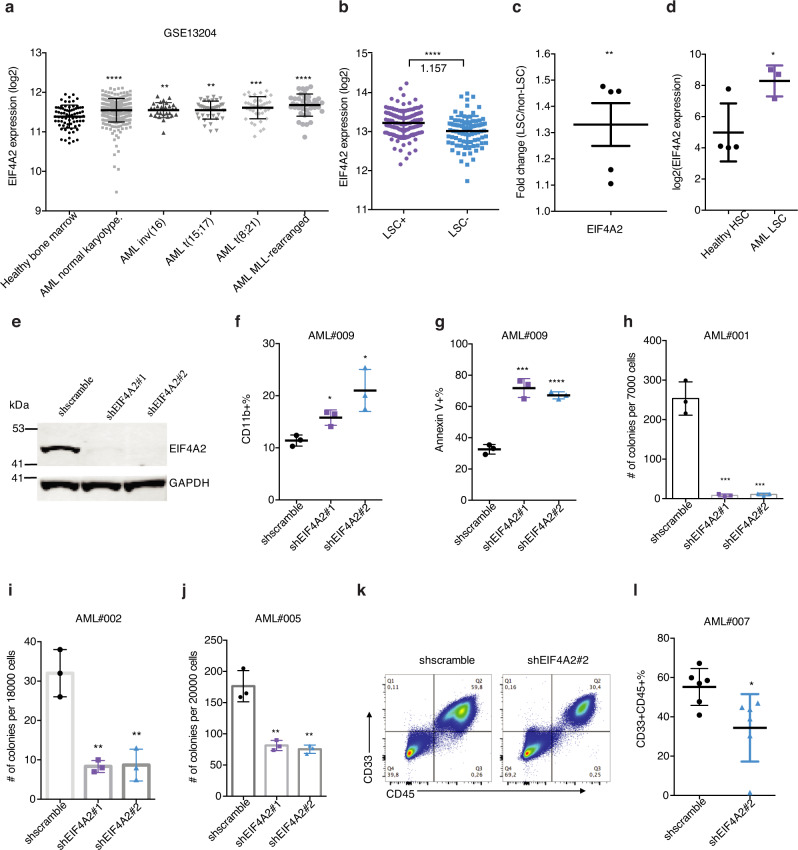
Fig. 6. EIF4A2 is required for sustaining primitive leukemic cell fitness.
a EIF4A2 mRNA expression in different subtypes of AML as compared to healthy bone marrow control, on the basis of data from Microarray Innovations in Leukemia (MILE) study (GSE13204). Data are presented as mean ± SD, two-tailed Student’s t test. b EIF4A2 transcript level in LSC-enriched (n = 138) vs LSC-depleted (n = 89) subsets from 78 AML patient samples (GSE76008). Average fold change of EIF4A2 expression in LSC-enriched over LSC-depleted subsets is indicated in the figure. Data are presented as mean ± SD, two-tailed Student’s t test. c EIF4A2 protein level as assessed proteomics analysis in functionally defined LSC and non-LSC populations from 5 AML patient samples (PXD008307). Data are presented as mean ± SEM, two-tailed Student’s t test. d Gene expression data (GSE35008) from sorted AML bone marrow samples were compared with data from healthy controls and revealed significantly increased EIF4A2 expression in AML LT-HSCs (Lin-CD34 + CD38-CD90 + , AML with normal karyotype, n = 3) compared with healthy control (n = 4). Data are presented as mean ± SD, two-tailed Student’s t test. e WB validation of EIF4A2 knockdown in GFP + transduced HL60 cells. f, g Flow cytometric evaluation of myeloid differentiation (f) and apoptosis (g) following EIF4A2 knockdown in primary AML cells. n = 3, mean ± SD, two-tailed Student’s t test. h–j Colony formation capacity following EIF4A2 knockdown in 3 AML samples. n = 3, mean ± SD, two-tailed Student’s t test. k, l Representative flow cytometry plots (k) and quantification (l) of AML engraftment (#007) after 8 weeks in bone marrow. n = 6 for each group. Shown is the percentage of human (CD45+) myeloid cells (CD33+) found in bone marrow. Data are presented as mean ± SD, two-tailed Student’s t test. Source data are provided as a Source Data file.

