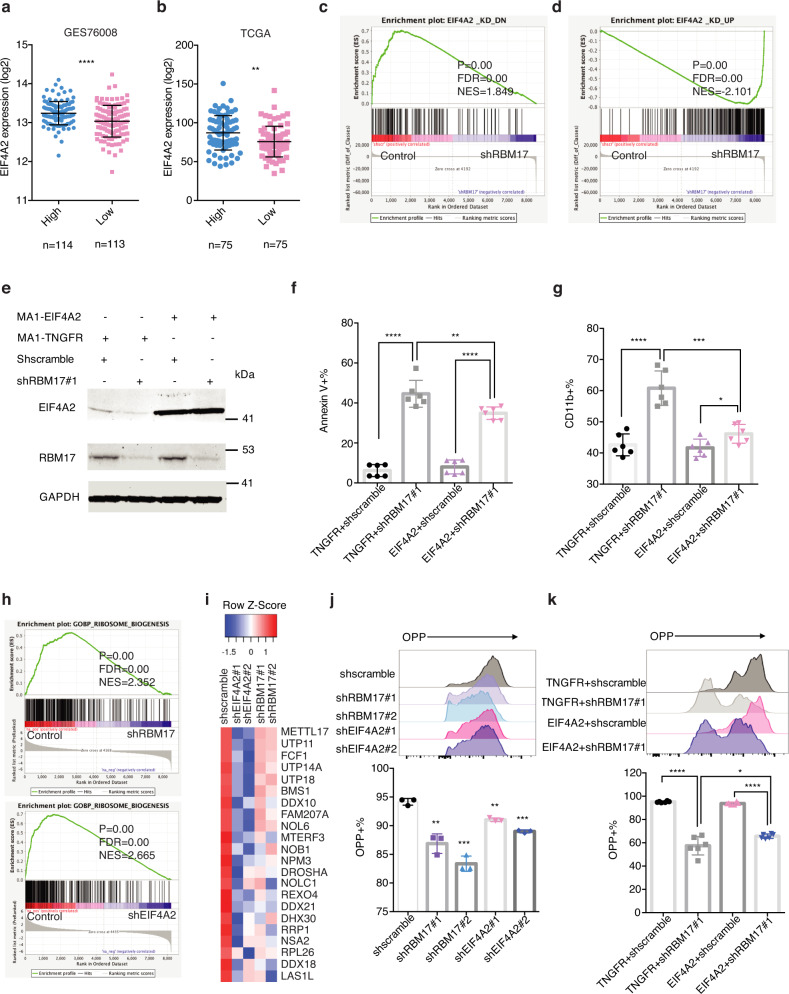
Fig. 7. EIF4A2 overexpression partially rescues the RBM17 knockdown phenotype in AML cells.
a, b Correlation analysis between RBM17 and EIF4A2 mRNA levels using the above microarray data about functionally defined 138 LSC-enriched and 89 non-LSC populations (P < 0.0001) (a) and TCGA dataset (P = 0.0013) (b). AML patient samples were ranked based on RBM17 expression, the population above the median value of RBM17 expression level was defined as ‘high’ RBM17 expression, while the population below the median value of RBM17 expression level was defined as ‘low’ RBM17 expression. Data are presented as mean ± SD, two-tailed Student’s t test. c, d GSEA enrichment plots showing RBM17 knockdown in K562 cells leads to downregulation of the EIF4A2_KD_DN gene set and upregulation of the EIF4A2_KD_UP gene set. The significance of NES was calculated using Kolmogorov-Smirnov statistics. e WB images showing expression of RBM17 and EIF4A2 in HL60 cells engineered to co-express TNGFR or EIF4A2 with and without RBM17 knockdown. n = 3 independent experiments. f, g Flow cytometry analysis of AnnexinV (f) and myeloid differentiation (g) in HL60 cells on day 8 following co-expression of TNGFR or EIF4A2 and knockdown of control scramble or RBM17. Data are presented as mean ± SD, n = 6. h GSEA enrichment plots showing EIF4A2 and RBM17 knockdown in K562 cells leads to downregulation of the GO ribosome biogenesis gene set. The significance of NES was calculated using Kolmogorov-Smirnov statistics. i Heat map showing downregulated proteins from the ribosome biogenesis gene set induced by EIF4A2 and RBM17 knockdown. j Representative histogram and quantification of flow cytometric detection of op-puro incorporation in HL60 cells on day7 following EIF4A2/RBM17 knockdown. Data shown as mean ± SD, n = 3, two-tailed Student’s t test. k Representative histogram and quantification of flow cytometric detection of op-puro incorporation in HL60 cells on day10 following simultaneous expression of TNGFR or EIF4A2 with or without RBM17 knockdown. Data shown as mean ± SD, n = 6, two-tailed Student’s t test. Source data are provided as a Source Data file.

