Figure 1.
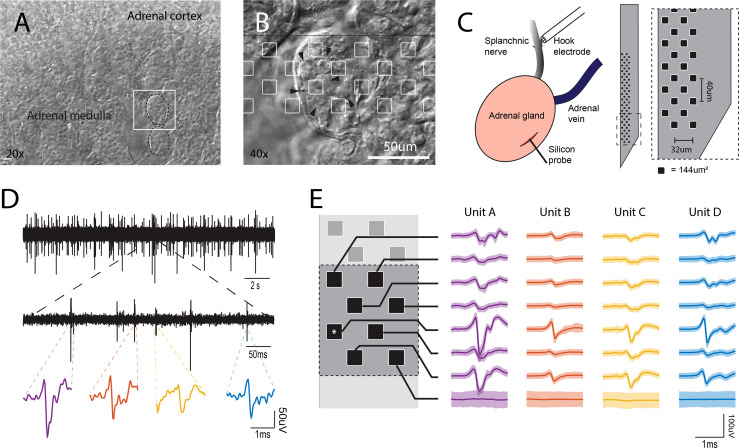
In vivo electrophysiological recordings from the intact adrenal medulla. (A) Low power bright field micrograph showing the adrenal cortex and the adrenal medulla. The white square represents the area shown in panel (B) B. Bright field micrograph showing the clustered architecture of the adrenal medulla (arrowhead = individual chromaffin cell). The silicon probe layout is shown in scale with the tissue, recording sites are presented as white squares. (C) Left, preparation in the anesthetized rat for simultaneous stimulation to the splanchnic nerve and the recording of the electrical activity in the adrenal medulla. Right, 64 channel silicon probe layout covering an area of 48x620 um (0.02976 mm2), the area of each individual recording site is 144µm2. (D) Spontaneous extracellular action potentials. Shown are recordings at low, medium and high expanded time scales. The most expanded recordings (bottom traces) show the waveforms of individual events. (E) A cell’s action potential projects distinct waveforms depending on its position to each recording site in the neighborhood (the asterisk represents the channel shown in (D), the set of these slightly different waveforms define a unit’s template and it is unique for each cell (solid line ± 2SD).

