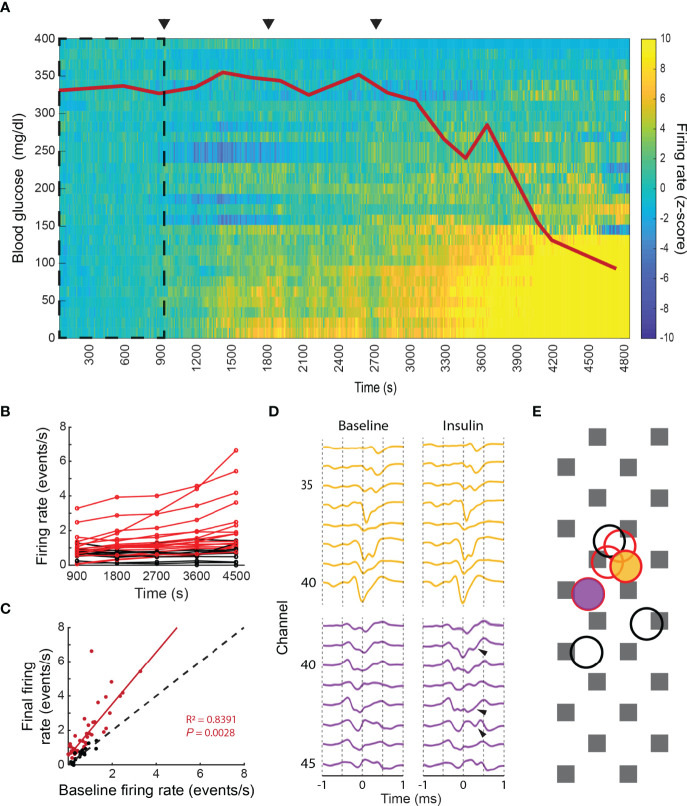
Figure 6.
Physiological stress response in the intact adrenal medulla. (A) The intraperitoneal administration of 3 increasing doses of insulin, 10, 100 and 1000 µg/kg (arrowheads), induced a decrease in the blood glucose levels (red line) that correlated with a significant increase in the firing frequency of a subpopulation of chromaffin cells. The z-score was calculated per unit in 10s bins by taking the first 900s as baseline (dashed square). The experiment was divided into five 15 minutes periods: baseline (1-900s), 10 µg/kg (901-1800s), 100 µg/kg (1801-2700s), 1000 µg/kg (2701-3600s) and final (3601-4500s) (B) Individual averaged firing rate for the different periods (red indicates units whose final averaged firing rate increased by more than 2 times its baseline’s SD or averaged z-score above 2, black indicates the units that presented no change between its baseline firing rate and final firing rate or an averaged z-score between ±2). (C) Linear regression between the baseline firing rate vs. final firing rate for 64 units recorded from 3 preparations. The coefficients for the linear fitting are 1.523 (1.265, 1.78 with 95% confidence bounds), the 45-degree dashed line represent no change between the two evaluated periods. (D) Waveform changes during hypoglycemia. Top template (yellow) displayed no changes between the baseline and the 1000 µg/kg periods, whilst additional spikes (arrows) were found in the bottom unit in comparison to its baseline template, both units presented a statistically significant increase in their firing rate between the two periods. (E) Firing rate change does not correlate with the spatial localization of the cells. The yellow and purple filled circles indicate the localization of the units shown in (D), which had increased firing rates upon hypoglycemia. The red and black unfilled circles represent the localization of additional units. Red circles represent cells whose firing rate increased; black circles represent cells whose firing rate decreased.

