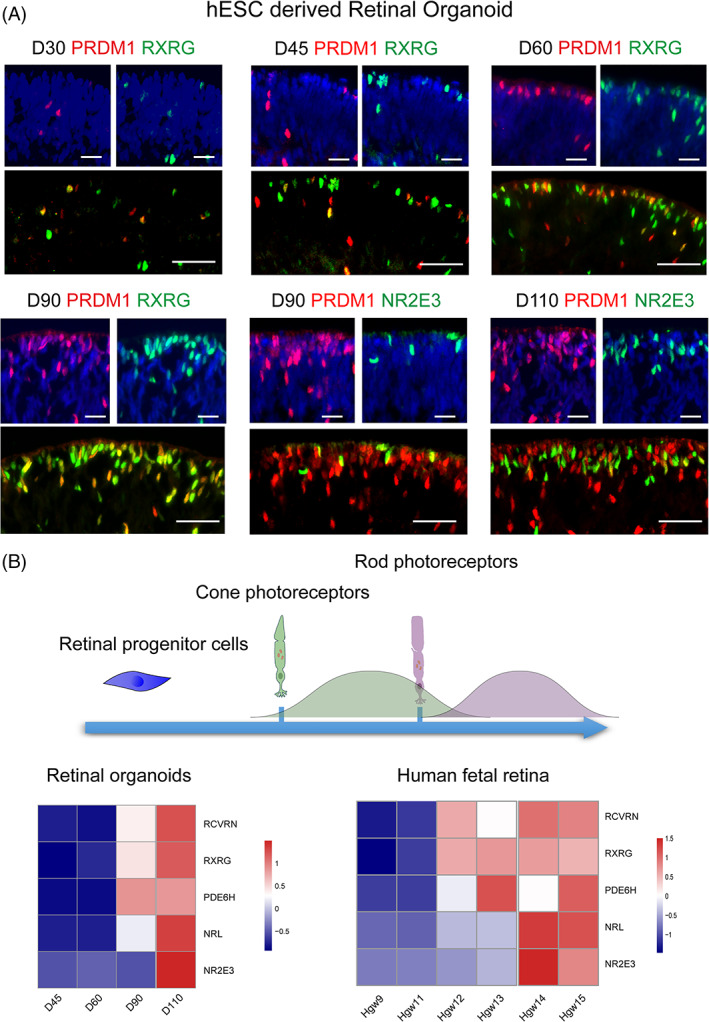
FIGURE 1.

Development of photoreceptors in retinal organoids. (A) Double staining of PRDM1 (red) with RXRG (green) or NR2E3 (green) in retinal organoids at different time points. Scale bar = 50 μm. (B) Schematic diagram showing the development of photoreceptors in retinal organoids. Single‐cell RNA‐sequencing data analysis showing the expression pattern of photoreceptor markers from Day 45 to Day 110 and from Hgw 9 to 15, respectively
