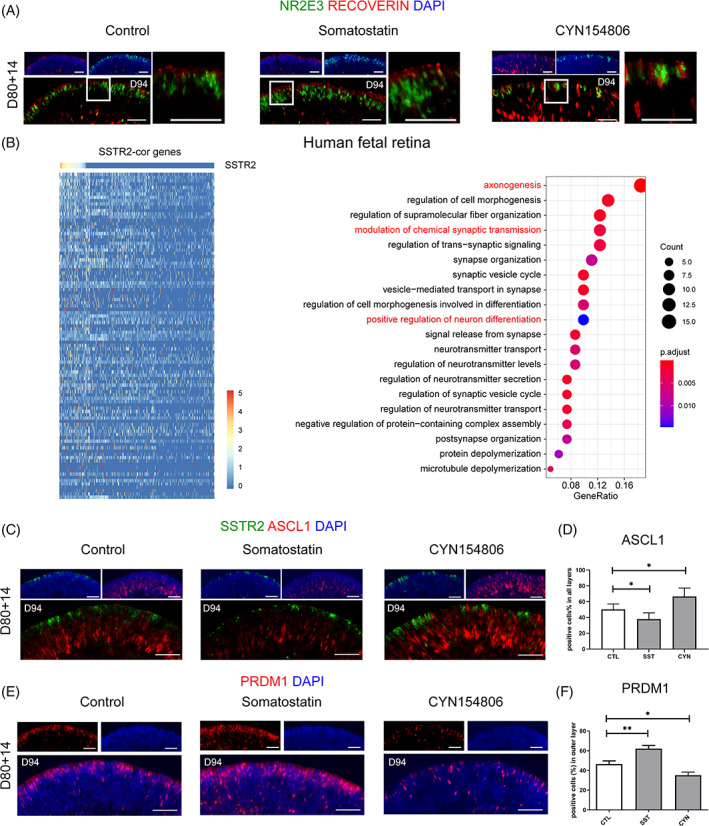
FIGURE 4.

Somatostatin signalling activation promoted photoreceptor maturation. (A) The representative images of RCVRN expression in control and SST treatment. Higher magnification demonstrated the outer and inner segment‐like structure with the treatment of SST. (B) Heatmap showing the genes that positively correlated with SSTR2 by Pearson correlation analysis. GO analysis showing GO terms such as “axonogenesis” and “synaptic transmission” were enriched in the top 100 correlated genes. (C) Representative examples of ASCL1 immunoreactivity (red) show increased expression upon CYN154806 treatment and decreased expression upon SST treatment. (D) Quantification analysis of ASCL1 expression. (E) The increasing expression of PRDM1 in somatostatin treatment and decreasing expression in CYN154806 treatment. (F) Quantification analysis of PRDM1 expression. (*p < 0.05, Scale bar = 50 μm, n = 6)
