
FIGURE 4.
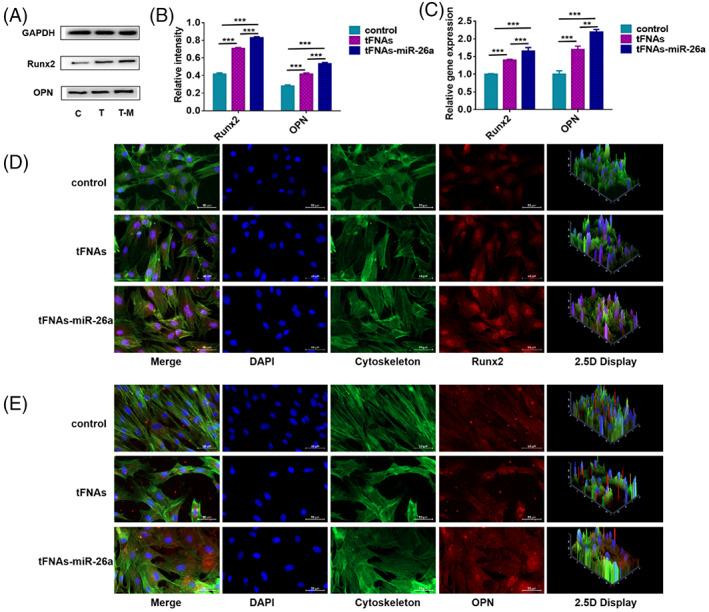
Detection of osteogenic differentiation‐specific proteins and genes. (A) Western blot analysis of protein expression levels upon exposure to tFNAs–miR‐26a (250 nM) for 24 h. (B) Quantification of protein expression levels upon exposure to tFNAs–miR‐26a (250 nM) for 24 h. Data are presented as mean ± SD (n = 4). Student's t test: **p < 0.01, ***p < 0.001. (C) Quantification of gene expression levels upon exposure to tFNAs–miR‐26a (250 nM) for 24 h. Data are presented as mean ± SD (n = 4). Student's t test: **p < 0.01, ***p < 0.001. (D) Photomicrographs showing treated ADSCs (Cytoplasm: green, Nucleus: blue, Runx2: red). Scale bars are 50 μm. (E) Photomicrographs showing treated ADSCs (Cytoplasm: green, Nucleus: blue, OPN: red). Scale bars are 50 μm.