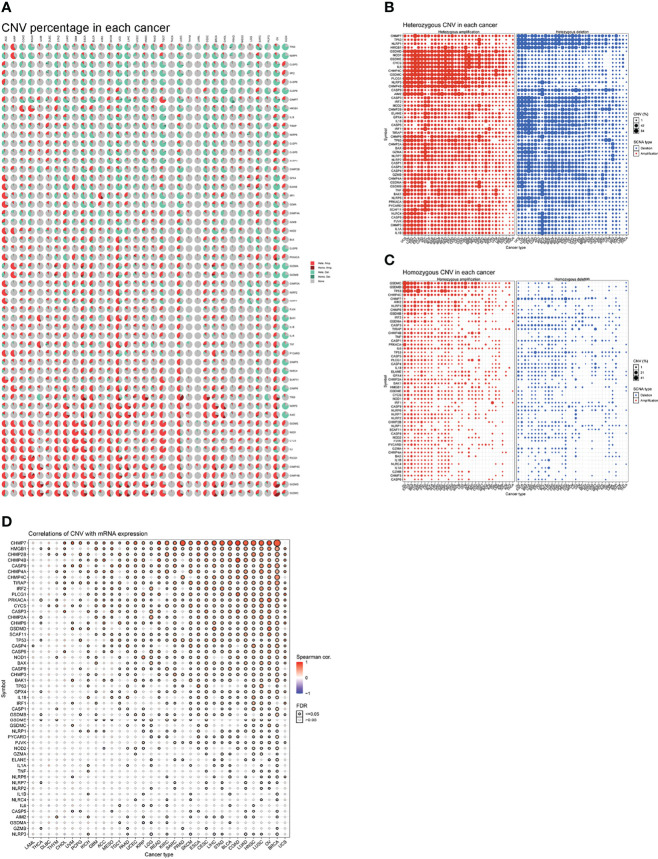
Figure 5.
(A) A pie chart representing the proportion of different types of CNV of one gene in one cancer, and different colors represent different types of CNV. Hete Amp = heterozygous amplification; Hete Del = heterozygous deletion; Homo Amp = homozygous amplification; Homo Del = homozygous deletion; None = no CNV. (B) Heterozygous CNV profile, including amplification and deletion percentage for each gene in each cancer. Only genes with >5% CNV in cancers are shown. The size of the point represents the statistical significance, where the bigger the dot size, the higher the statistical significance. FDR, false discovery rate. (C) Homozygous CNV profile, including amplification and deletion percentage for each gene in each cancer. Only genes with >5% CNV in cancers are shown. The size of the point represents the statistical significance, where the bigger the dot size, the higher the statistical significance. FDR, false discovery rate. (D) mRNA expression and CNV data merged by TCGA barcode. The association between paired mRNA expression and CNV percent samples was tested based on Pearson’s product-moment correlation coefficient and follows a t-distribution. The size of the point represents the statistical significance, where the bigger the dot size, the higher the statistical significance. FDR, false discovery rate.

