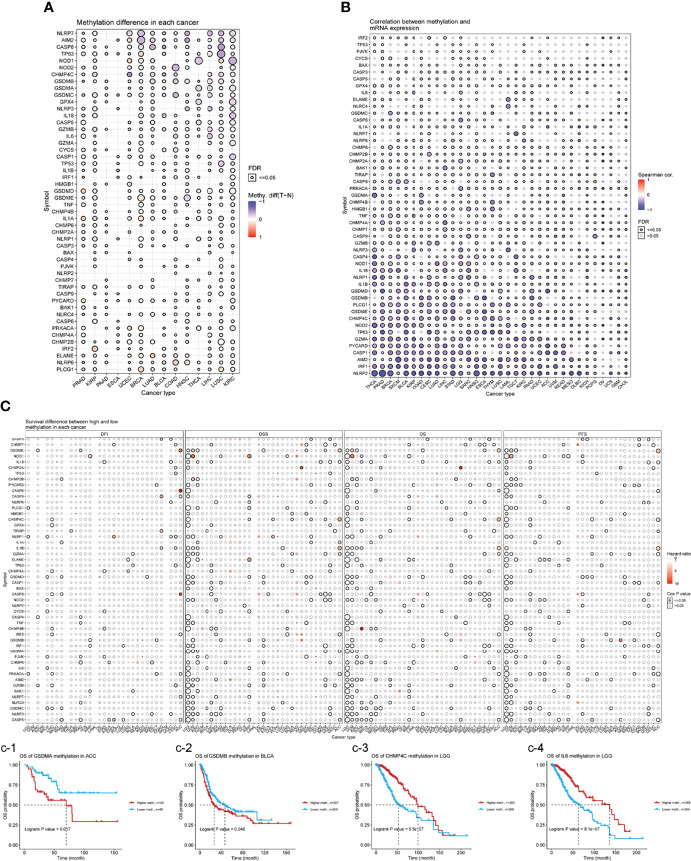
Figure 6.
(A) Differential methylation in necroptosis-related genes between tumor (T) and normal (N) samples in each cancer. Red dots represent increased methylation in tumors and blue dots represent decreased methylation in tumors. The darker the dot color, the larger the difference in methylation level. (B) Correlations between methylation and mRNA levels of genes in specific cancers. Red points represent a positive correlation, and blue dots represent a negative orrelation. The size of the point represents the statistical significance, where the bigger the dot size, the higher the statistical significance. FDR, false discovery rate. (C) Survival difference between necroptosis-related genes with high and low methylation levels and samples. Red dots represent worse survival of the hypermethylation group; blue dots represent the opposite. The dot size represents the statistical significance, the larger the dot size means, the higher the statistical significance.

