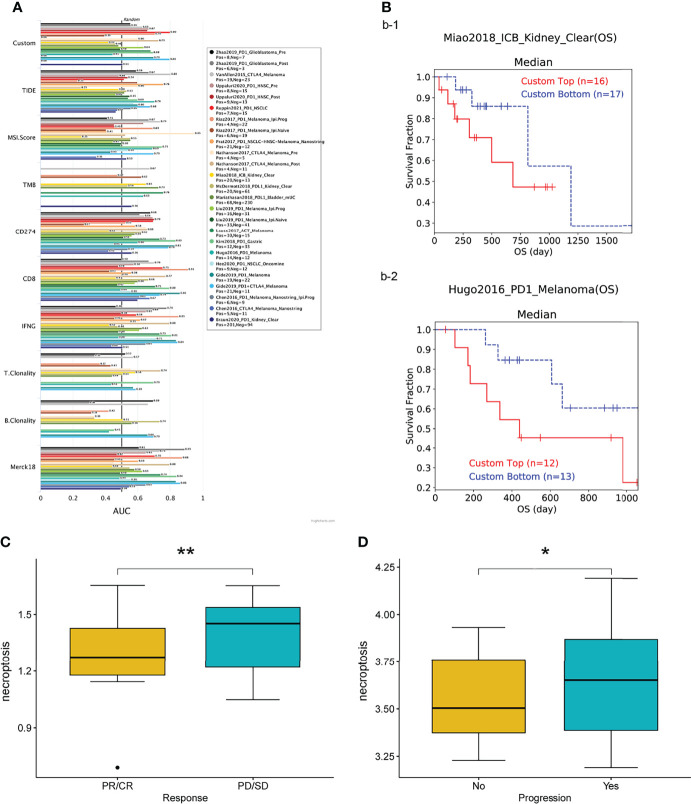
Figure 9.
(A) Bar plot showing the biomarker relevance of necroptosis scores compared to standardized cancer immune evasion biomarkers in immune checkpoint blockade (ICB) sub-cohorts. The area under the receiver operating characteristic curve (AUC) was used to assess the predictive efficacy of test biomarkers for determining IBC response to TCGA for different cancer types. (B–D) Patients with high scores exhibit poorer prognostic outcomes after immunotherapy. CR, complete responses; PR, partial responses; PD, progressive disease; SD, stable disease. *P < 0.05, **P < 0.01.

