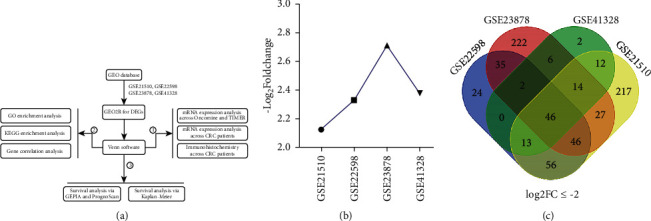
Figure 1.

Flowchart and Venn diagram of DEGs. (a) Flowchart. (b) LRRC19 expression level in 4 GEO databases. (c) 46 DEGs downregulated in the four datasets (log2FC ≤ −2). Different colors meant different datasets. The overlapped areas show the number of DEGs among GSE21510, GSE22598, GSE23878, and GSE41328.
