
Figure 6.
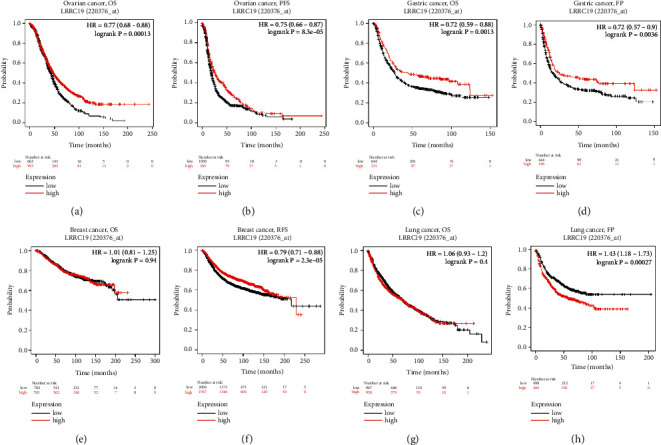
Kaplan–Meier survival curves comparing the high and low expressions of LRRC19 in different types of cancer in the Kaplan–Meier plotter databases. (a)-(b) OS and PFS survival curves of ovarian cancer (n = 1,657, n = 1,436). (c)-(d) OS and FP survival curves of gastric cancer (n = 881, n = 645). (e)-(f) OS and RFS survival curves of breast cancer (n = 1,402, n = 3,955). (g)-(h) OS and FP survival curves of lung cancer (n = 1,927, n = 982). OS, overall survival; PFS, progression-free survival; FP, first progression; RFS, relapse-free survival.