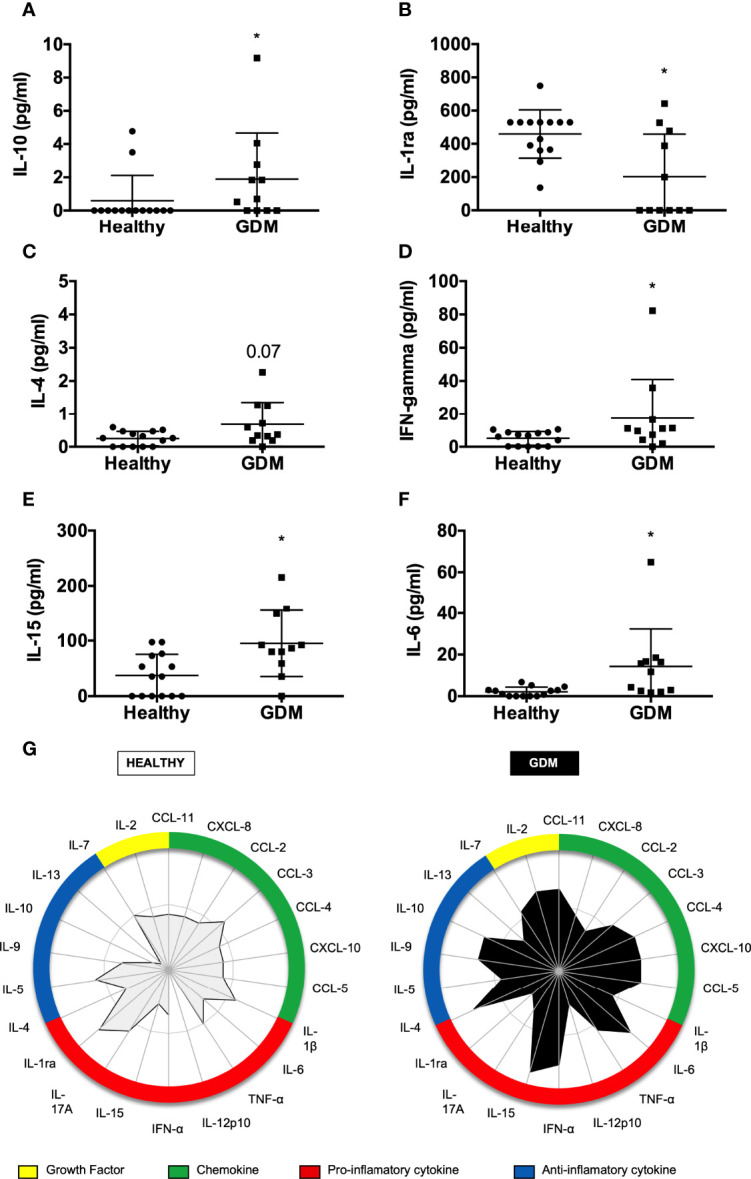
Figure 1.

Comparison of cytokine levels in colostrum between healthy and GDM mothers. The concentrations of cytokines and chemokines were measured in colostrum by Luminex. The circles represent women classified as having a usual gestational risk. The squares represent women with GDM. A total of 25 samples were included in the analyses. Each geometric figure represents a participant. (A) IL-10, (B) IL-1ra, (C) IL-4, (D) IFN-γ, (E) IL-5, (F) IL-6. *p < 0.05. (G) Global profile of cytokines/chemokines in colostrum of postpartum women, according to risk classification during pregnancy. The radar graph shows the frequency of high producers of pro-inflammatory, anti-inflammatory, and chemokines levels, and the contribution of each in the different categorizations (habitual risk and GDM).
