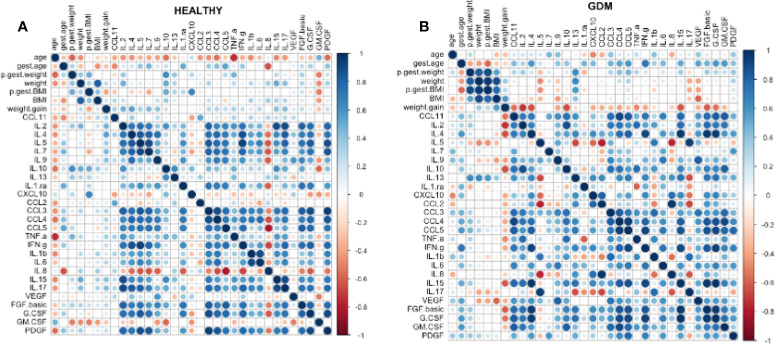
Figure 3.
Spearman’s correlation was performed to verify the correlation between the 27 bioactive factors measured in the colostrum and the numerical variables. In the healthy group, dot colors are less intense, and we observed a more positive correlation between the bioactive factors themselves (A). A more significant correlation between the variables was observed mainly in the group of women who presented with GDM (B), through the intensity of the colors (more intense blue = stronger correlation). In addition, there is a negative correlation (more intense red = stronger negative correlation) between weight gain and the biomarkers.

