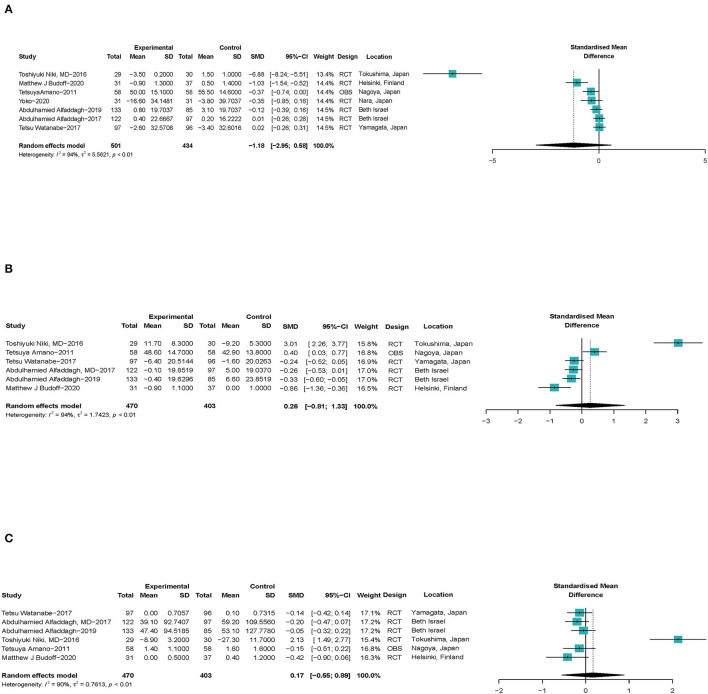
Figure 5.
Forest plots of associations of ω-3 PUFAs and coronary atherosclerotic plaque compositions. (A) Lipid plaque volume, (B) fiber plaque volume, and (C) calcified plaque. Point sizes are an inverse function of the precision of the estimates, and bars correspond to 95% CIs. Data are calculated using a random-effect model. RCT, randomized controlled trial; OBS, observational study.

