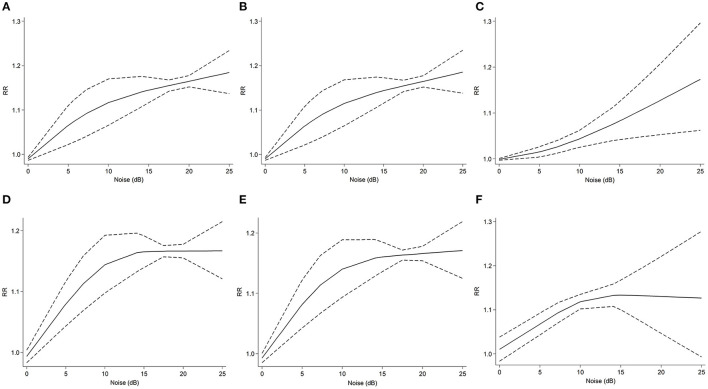
Figure 3.
Dose-response meta-analysis between noise exposure and risk of different types of dementia. The horizontal axis represents the noise increment, and the vertical axis represents the relative risk of noise increase to dementia. The two dashed lines represent the upper and lower limits of the 95% confidence interval for relative risk. (A) dose-response analysis of noise increment and AD risk in all studies. (B) dose-response analysis of noise increment and risk of AD and dementia in all studies. (C) dose-response analysis of noise increment and risk of VaD and NAD in all studies. (D) dose-response analysis of noise increment and AD risk in cohort studies. (E) dose-response analysis of noise increment and risk of AD and dementia in cohort. (F) dose-response analysis of noise increment and risk of VaD and NAD in cohort studies.

