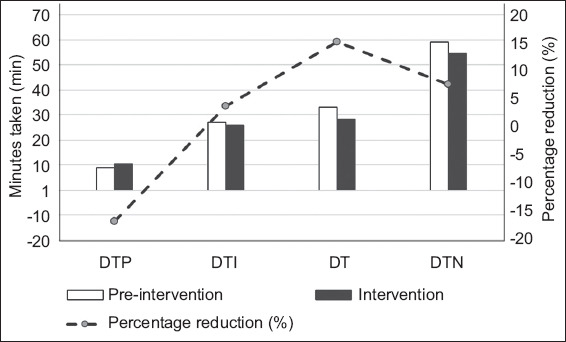
Fig. 3.

Chart (y1-axis) shows the time taken for DTP, DTI, DT and overall DTN in the pre-intervention and intervention periods. Chart (y2-axis) shows the percentage reduction in DTP, DT, DT and overall DTN in the pre-intervention and intervention periods. DT: decision time; DTI: door-to-imaging time; DTN: door-to-needle time; DTP: door-to-physician time
