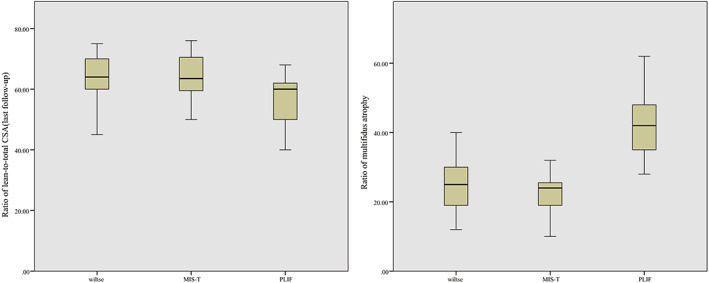
Fig. 6.

Ratio of lean‐to‐total CSA:PLIF group (56.60% ± 7.52%) was lower than in Wiltse group (63.34% ± 7.74%) and MIS‐TLIF group (64.03% ± 7.19%). Ratio of multifidus atrophy: PLIF group (41.70% ± 8.84%) was significantly higher than that in the Wiltse group (24.13% ± 6.82%) and the MIS‐TILF group (22.35% ± 5.03%)
