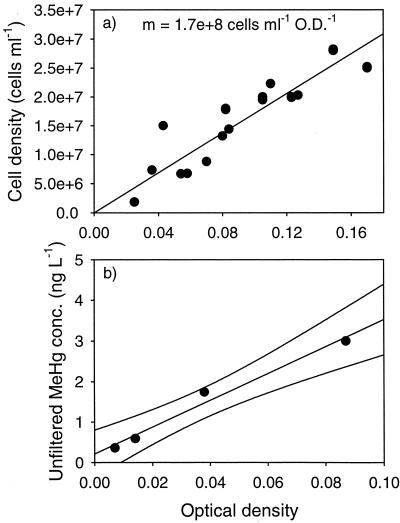
FIG. 1.
Relationship between cell density and MeHg production. (a) OD versus cell density; (b) OD in dilutions of a culture of D. propionicus versus final MeHg concentration. Spike concentration was 800 ng of Hg liter−1, and cultures were incubated for 4 h. The culture dilutions were not duplicated; lines represent the best fit determined by linear regression of the data, r2 = 0.98.

