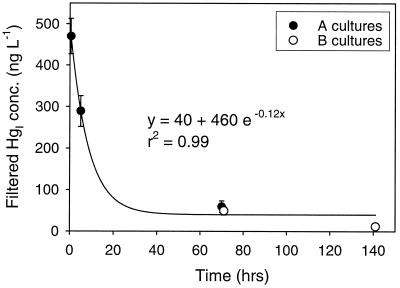
FIG. 4.
Kinetics of the loss of added HgI from solution in the Hg bioavailability time course experiment. Filtered HgI is plotted for both experiments relative to the time of spike addition. Initial spike concentration was 1,000 ng liter−1. Averages for replicate cultures are shown; error bars represent 1 standard deviation. Error bars that are not discernible fall within the symbol.

