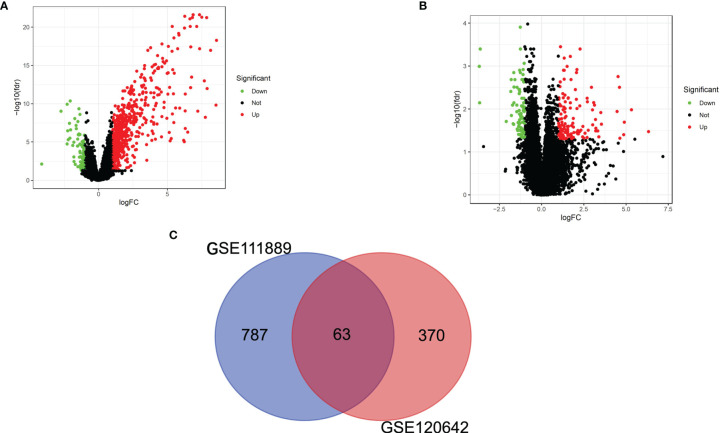
Figure 1.
Identification of common DEGs. (A) Volcano plot revealing 850 DEGs between the CD patients and healthy controls. (B) Volcano plot revealing 433 DEGs between PAD patients and healthy controls. (C) A total of 63 common DEGs were identified after taking the intersection of DEGs in CD and PAD. DEG, differentially expressed gene; CD, Crohn’s disease; PAD, peripheral artery disease.

