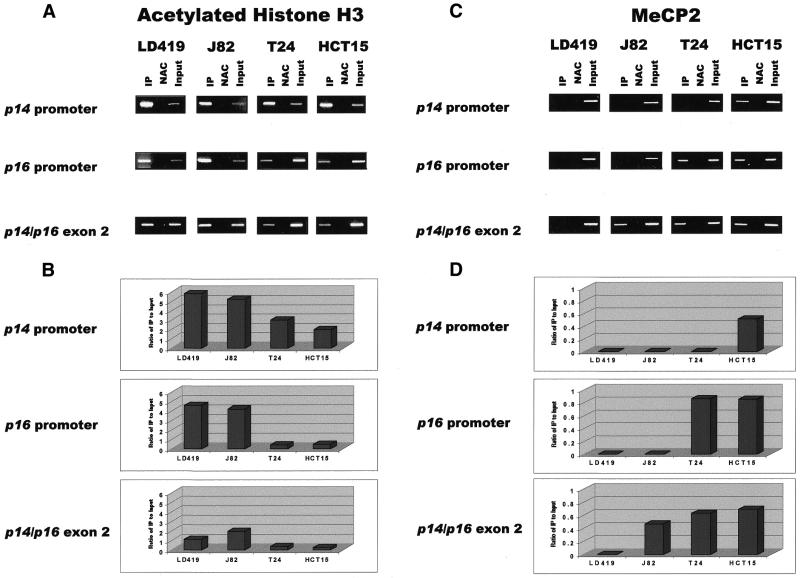
Figure 4.
(A) Results of ChIP assays performed with antibody against acetylated histone H3. IP, immunoprecipitated DNA; NAC, no-antibody control; Input, sample representing amplification from a 1:100 dilution of total input chromatin from each ChIP experiment. Experimental reactions were performed to determine optimal PCR conditions so that the yield of PCR products was dependent on the amount of input DNA (data not shown). The lengths of the PCR products corresponding to the p14 promoter, p16 promoter and shared exon 2 are 383, 312 and 363 bp, respectively. Each ChIP experiment was repeated three times to confirm reproducibility of results. (B) UV quantitation of acetylated histone H3 ChIP PCR results. Relative differences in the levels of immunoprecipitated DNA (which are reflective of the levels of the chromatin protein of interest occupying a particular island) between different islands and cell lines were quantified by dividing UV intensity of immunoprecipitated bands by the intensity of the input band, which is representative of the level of total input chromatin in a particular ChIP assay. (C) Results of ChIP assay performed with antibody against MeCP2. (D) UV quantitation of MeCP2 ChIP PCR results.

