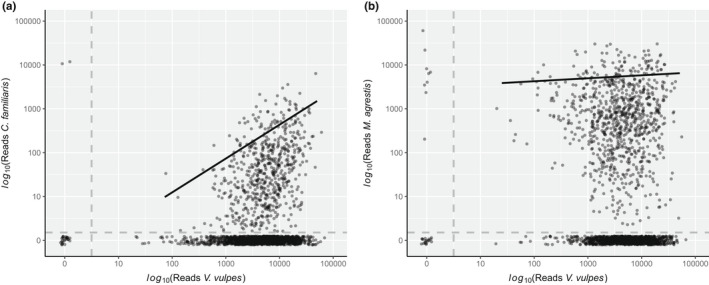
FIGURE 1.

Number of DNA sequence reads of domestic dog (a) and field vole (b) over DNA sequence reads of red fox at PCR level (n = 1941; 647 scats × 3 amplification replicates). Data were transformed with a base 10 logarithm after adding one read to all samples. Gray dashed lines divide the data into four areas: No reads of either species (bottom left), positive for dog (a) or vole (b) reads but no fox reads (top left), negative for dog/vole reads but positive for fox (bottom right) and positive for reads of either species (top right). Solid black lines represent the 90th quantile regressions over non‐zero data
