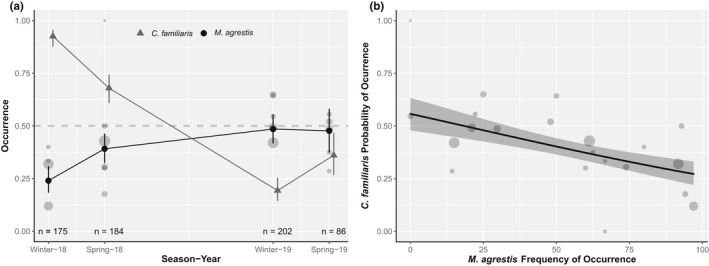
FIGURE 2.

Generalized liner model outputs. (a) Predicted probability of occurrence of domestic dog DNA (black circles) and field vole (gray triangles) in scat samples of red fox at each sampling season and across sites. Line ranges represents 95% confidence interval. The number of fox samples in each season is printed at the bottom of the panel. (b) Predicted probability of occurrence of domestic dog in red fox samples over field vole frequency of occurrence. Shaded area shows 95% confidence interval. Raw data of dog frequency of occurrence plotted as gray circles weighted by sample size in both panels
