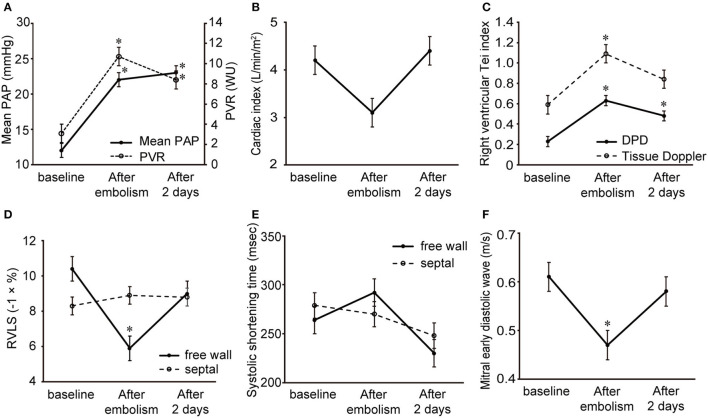
Figure 2.
Changes in the hemodynamic variables and echocardiographic indices in a dog model of acute pulmonary embolism. Data are shown as the mean ± standard deviation. (A) Mean pulmonary arterial pressure and pulmonary vascular resistance. (B) Cardiac index. (C) Right ventricular Tei index by dual pulsed-wave Doppler and tissue Doppler. (D) Free wall and septal right ventricular longitudinal strain. (E) Systolic shortening time of free wall and septum. (F) Mitral early diastolic wave. *P < 0.05 compared with the baseline.

