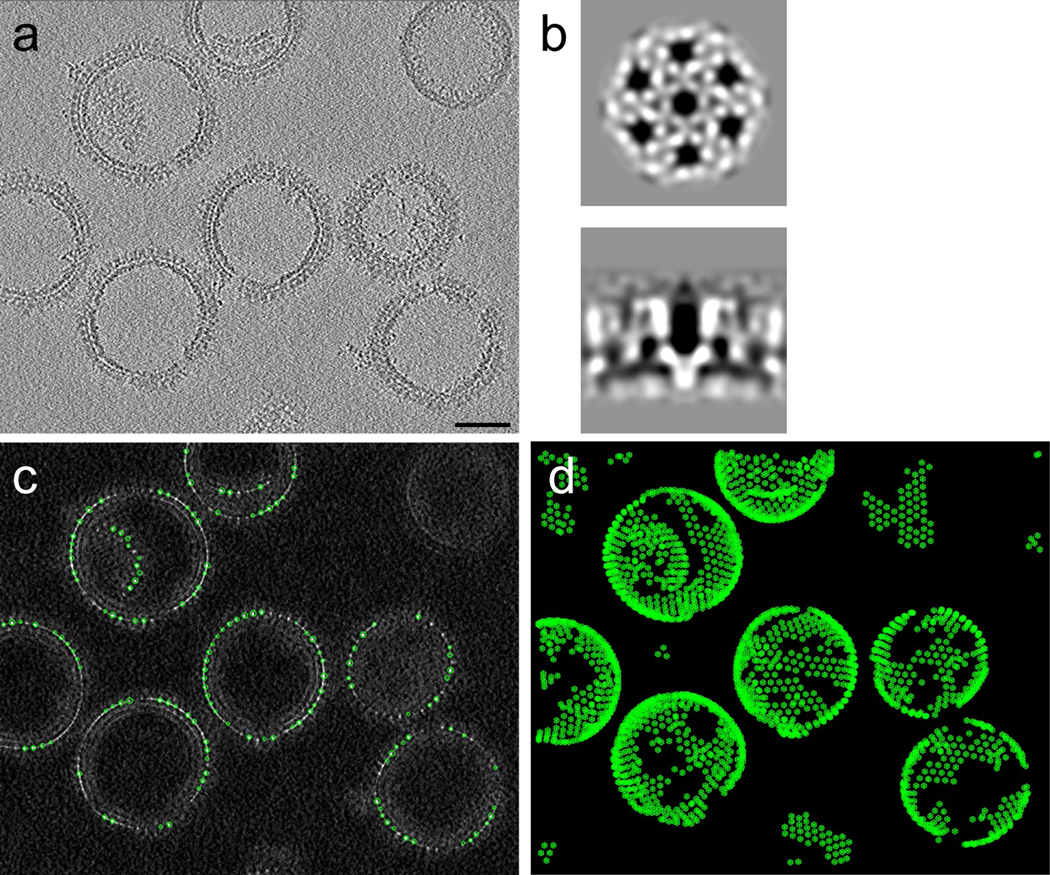
Figure 2 |. Template matching.
(a) A typical tomographic slice (6 nm thick) depicting HIV-1 Gag T8I assemblies from the raw data. (b) The template used for particle picking, top and side views of HIV-1 Gag map (EMD-8403) low-pass filtered to 25 Å. (c) A tomographic slice of resulting convolution map overlaid with template matched model points of top cross-correlation peaks. (d) A projection view of model points through the tomogram volume. Scale bar is 50 nm.
- If found this confusing. What is the connection between the image in panel A and that shown in panel B?
- You mention “template search”. What template is used? If meaningful, could you add the template to the figure?

