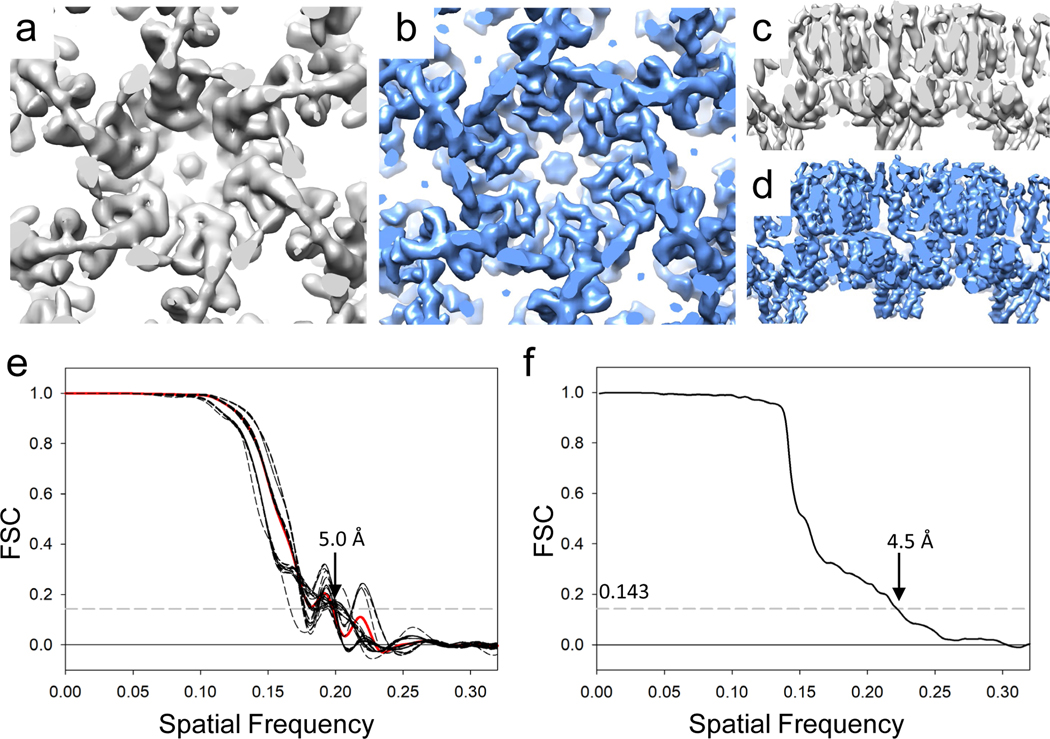
Figure 4 |. Subtomogram averages and conical FSC plots of HIV-1 Gag T8I assemblies (5 tilt series).
(a&c) A subtomogram averaged map of Gag T8I assemblies at 5.0 Å resolution, derived from seven classes (1–7) in Figure 3, viewed from top (a) and side (c). (b&d) Reconstruction of Gag T8I assemblies from projection images at 4.5 Å resolution using cisTEM with one cycle of additional translational refinement, viewed from top (b) and side (d). (e) Conical Fourier Shell Correlation plots of subtomogram averaged map shown in (a). The solid red curve represents the global FSC, while each dashed curve represents the FSC of a cone of 36° of half angle, with a 30° increment between each cone. (f) FSC plot of cisTEM reconstructed map shown in (b).
- I don’t know what a Fourier Shell Correlation plot is; and I don’t know what “spatial frequency” means.
- I don’t know what is special about 0.143
- I can see that there might be different information in the subtomogram and the cisTEM methods. But it is difficult to work what is important.

