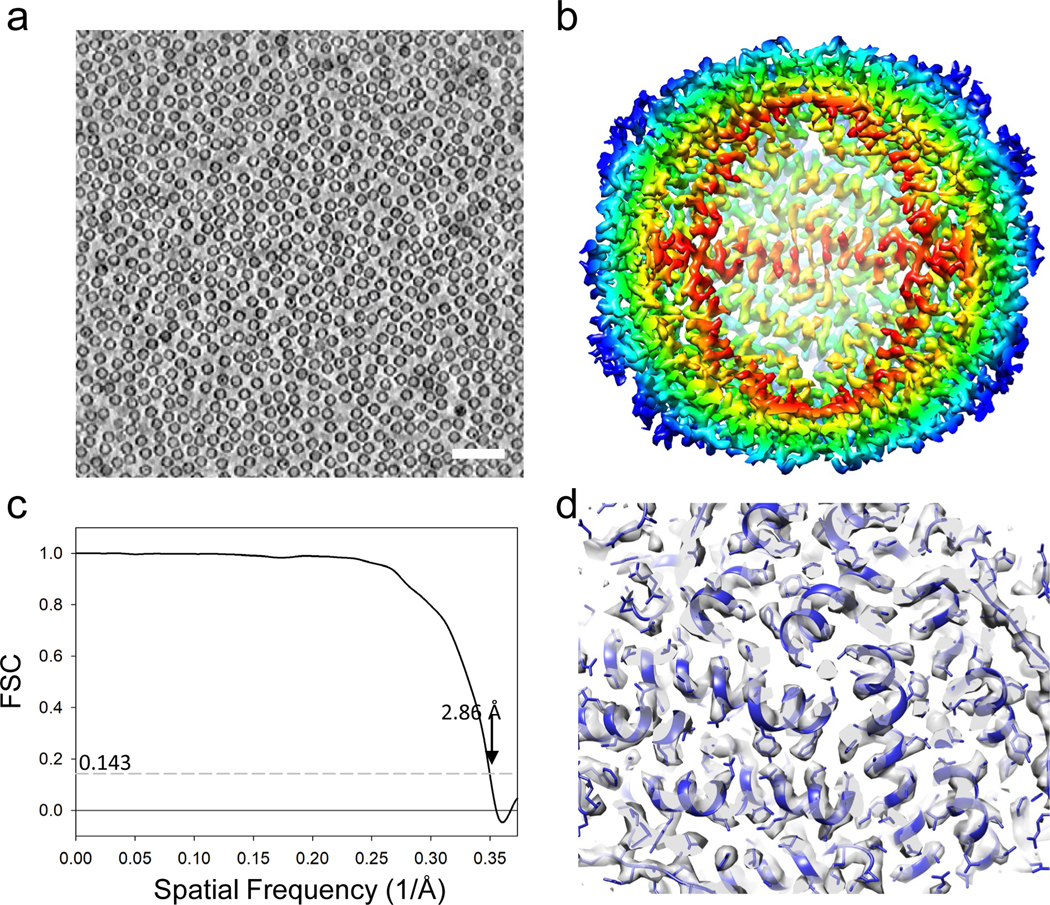
Figure 7 |. Subtomogram averaging of apoferritin (6 tilt series).
(a) A tomographic slice of apoferritin on graphene grids. Scale bar: 50 nm. (b) Subtomogram averaged map of apoferritin at 2.86 Å resolution. The density map is coloured radially 40 Å (red) to 60 Å (blue) from the centre. (c) FSC plot of the averaged map. The resolution is 2.86 Å with an FSC cut-off of 0.143, approaching the Nyquist frequency which is the edge of the plot. (d) Representative density maps (fitted with PDB model 6s61).

