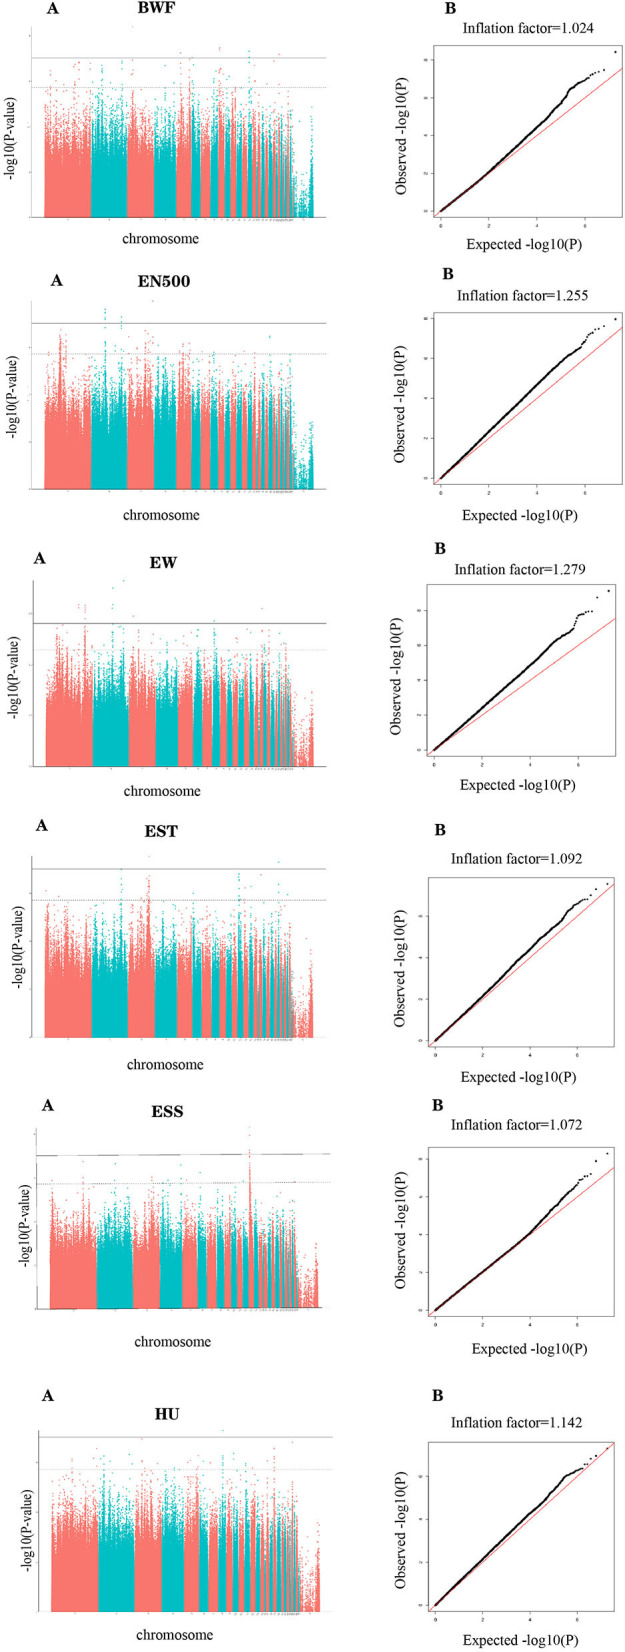
Figure 1.

Manhattan (A) and Q-Q plots (B) were derived from GWAS for body weight at first oviposition (BWF), number of eggs produced in 500 days (EN500), Egg weight (EW), egg shell thickness (EST), egg shell strength (ESS), and Haugh unit (HU). Each dot on this figure corresponds to an SNP within the dataset, while the horizontal solid and dotted lines denote the genome-wide significance (9.47E-08) and suggestive significance thresholds (1.89E-06), respectively. The Manhattan plot contains –log10 observed p-values for genome-wide SNPs (y-axis) plotted against their corresponding position on each chromosome (x-axis), while the Q-Q plot contains expected –log10-transformed p-values. Use plotted against observed –log10 transformed p-values.
