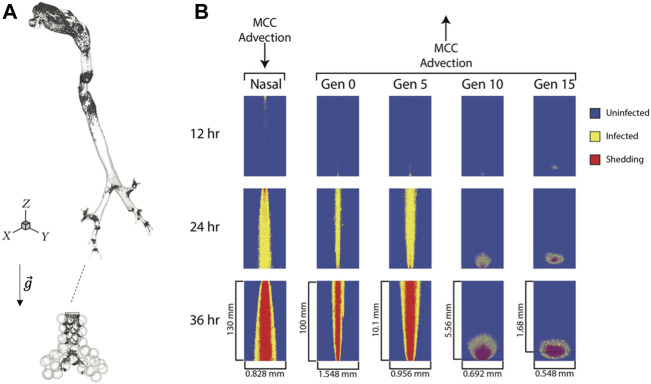
FIGURE 3.
Viral particle deposition and spread of infected cells. (A) Deposition patterns of 1 µm particles inhaled at a flow rate of 0.5 L/s in a model of the human lung highlighting the heterogeneous nature of deposition patterns both in the conducting airways and in the alveolar region (not to scale), : gravity vector (modified from (Li et al., 2014) and (Ma and Darquenne, 2011)). (B) Snapshots of the spread of infected epithelial cells from a single infected cell in the nasal passage, trachea (Gen 0), Gen 5, 10 and 15 over a period of 36 h. Note the horizontal and vertical scales for each column are specific to each generation (reproduced from (Chen et al., 2022) copyright 2022, with permission from Elsevier).

