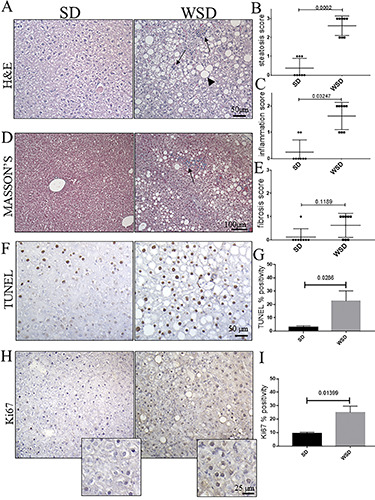
Figure 1.

A) Hematoxylin and eosin; the liver parenchyma of WSD-fed mice showed severe signs of steatosis (arrowhead), compared with SD-fed mice; rare and isolated inflammation foci are detected in SD mice compared with the WSD group (arrows); original magnification 20×, scale bar: 50 μm. B,C) Steatosis and inflammation scores differed significantly between WSD and SD mice. D) Masson’s trichrome staining; no collagen depositions are detected in SD mice, while mild fibrosis is highlighted (arrows) in WSD animals; original magnification 10×, scale bar: 100 μm. E) Fibrosis scores were not significantly different in WSD vs SD mice. F) The TUNEL assay and (H) the immunohistochemical labeling for Ki-67 showed an increase in Tunel-positive cells in WSD compared to SD mice; original magnification 20×, scale bar: 50 μm. G,I) Semi-quantitative analyses confirmed a significant increase of apoptotic pathways, and Ki-67 expression. These images are representative of n=8 SD, and n=8 WSD mice. Values represent means ± standard deviation. Data were analyzed using the Mann-Whitney test; SD, standard diet; WSD, Western-style diet.
