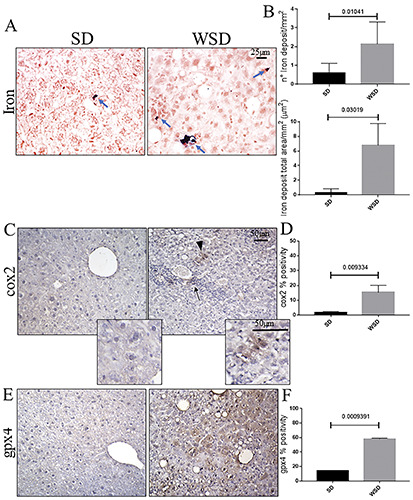
Figure 4.

A) Prussian blue staining showed increased iron deposits (arrows) in WSD mice compared to the SD group; original magnification 40×, scale bar: 25 μm. B) Quantification of iron deposits, in both number and area, showed a significant increase in iron content in WSD-fed mice compared to the SD group. C) Immunohistochemistry for Cox2 showed an increase in immunopositivity in WSD compared to SD mice; original magnification 20×, scale bar 50 μm; inset, scale bar: 50 μm; arrowhead, epithelial-like Cox2-positive cells; arrow, Cox2-positive inflammation focus. D) Semi-quantitative analyses confirmed a significant increase in Cox2 expression. E) Immunohistochemistry of Gpx4 showed increased positivity in WSD mice compared to the SD group; original magnification 20×, scale bar: 50 μm. E) The semi-quantitative evaluation highlighted a significant increase of expression in WSD-fed mice compared to the SD group. These images are representative of n=8 SD, and n=8 WSD mice. Values represent means ± standard deviation. Data were analyzed using the Mann-Whitney test; SD, standard diet; WSD, Western-style diet.
