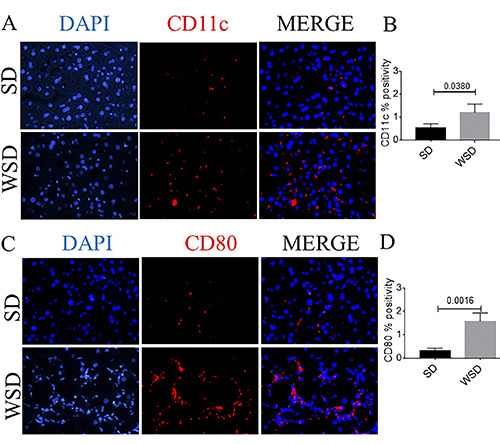
Figure 6.

A) Immunofluorescence analysis of CD11c (red) showed an increase in CD11c-positive cells in WSD-fed mice compared to the SD group.(B) Quantification of A. C) Immunofluorescence analysis of CD80 (red) showed an increase in CD80-positive cells in WSD-fed mice compared to the SD group; nuclei are counterstained with DAPI (blue); original magnification 40×, scale bar: 50 μm. (D) Quantification of C. These images are representative of n=8 SD, n=8 WSD mice. Values represent means ± standard deviation. Data were analyzed using the Mann-Whitney test; SD, standard diet; WSD, Western-style diet.
