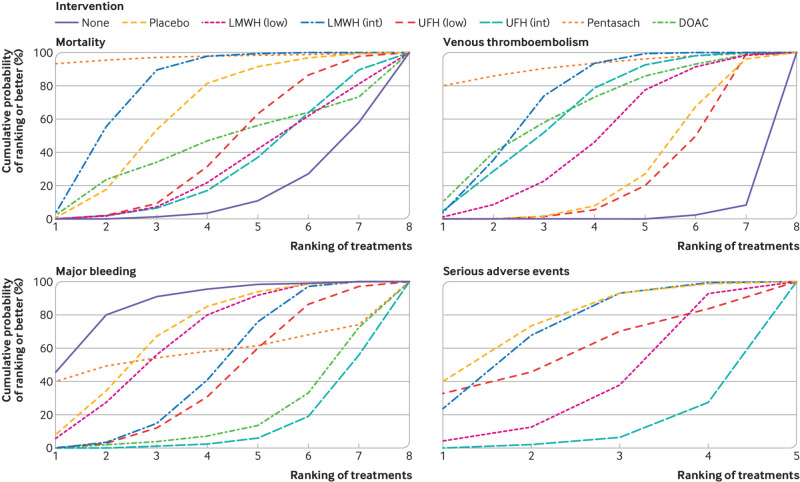
Fig 4.
Cumulative ranking curves for all four outcomes. Graphs show the cumulative probability of each intervention ranking, from best (rank 1) to worst (rank 8 or 5 depending on the number of treatments) for each outcome. A rank indicates the probability that an intervention is best, second best, etc. For example, pentasaccharides and intermediate dose LMWH ranked best for preventing venous thromboembolism, whereas no intervention ranked worst. DOAC=direct oral anticoagulant; int=intermediate dose; low=low dose; LMWH=low-molecular-weight heparin; Pentasach=pentasaccharides; UFH=unfractionated heparin. An interactive version of this graphic is available at: https://bit.ly/3nmPgNs

