
Figure 1. COApm is activated by LPS-treated females.
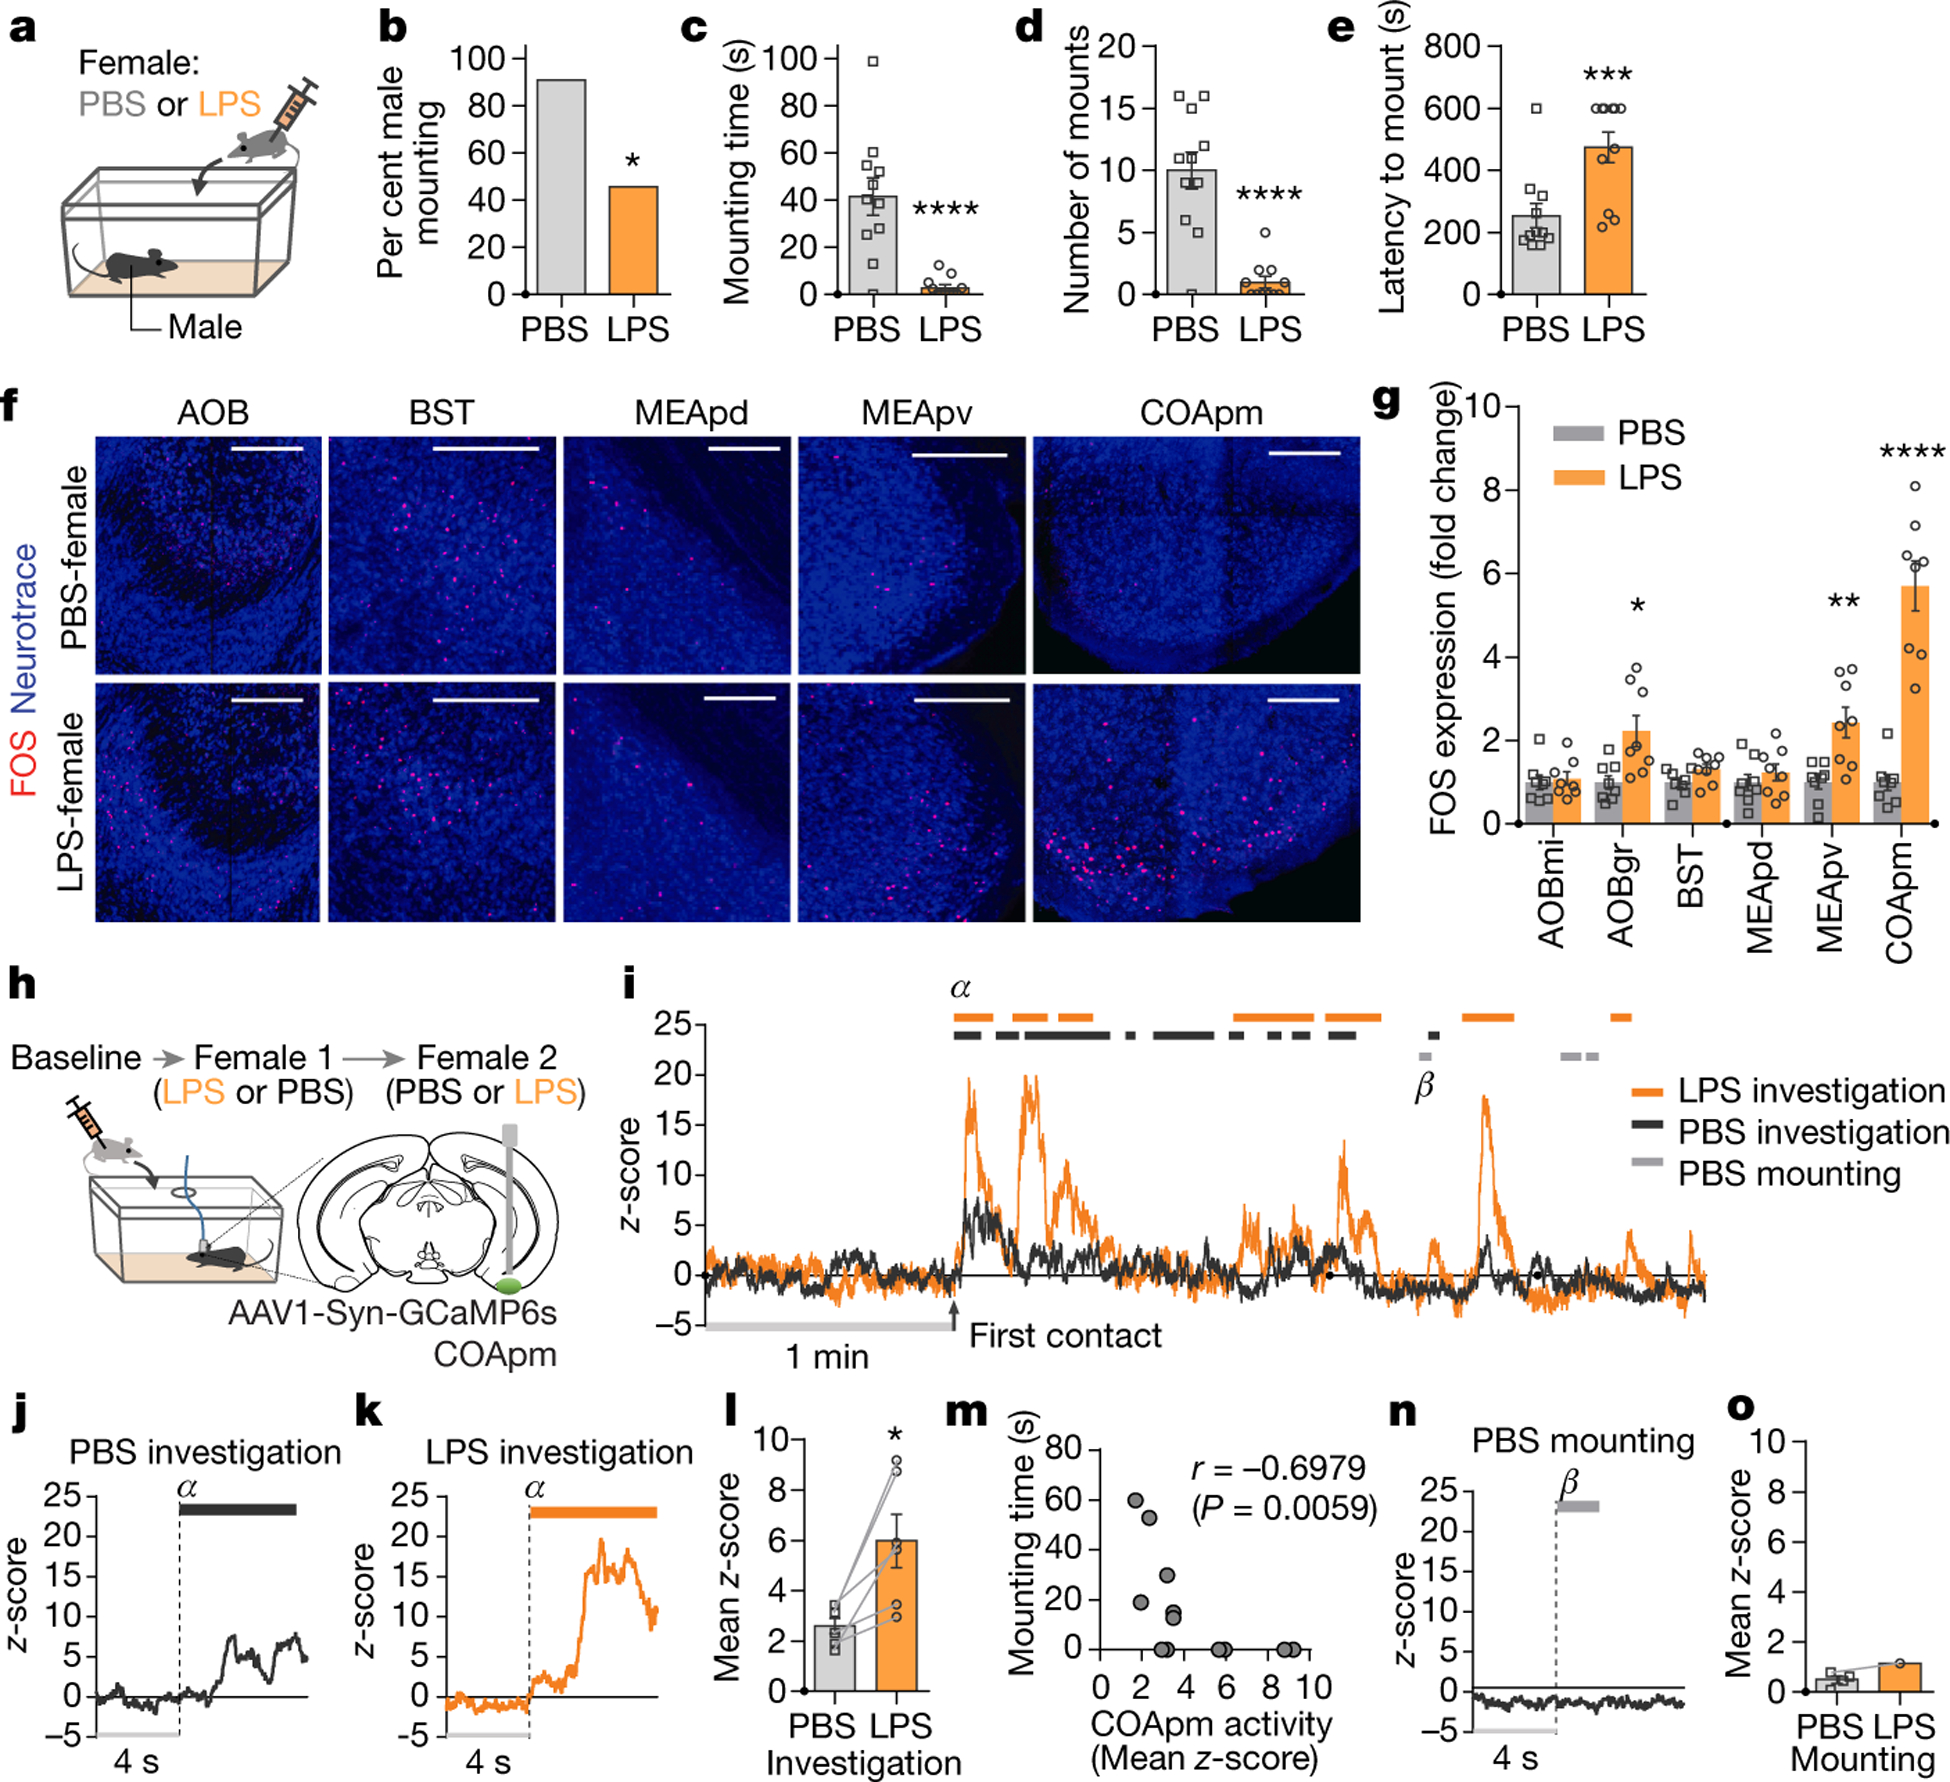
a-e, Male mounting behaviors towards a PBS- or LPS-treated female. Percentage of males engaged in mounting behavior (percent male mounting) (b), total duration of mounting bouts (mounting time) (c), number of mounting attempts (number of mounts) (d) and latency to the first mounting attempt (latency to mount) (e) during a 10-min test (PBS, n=11 and LPS, n=11; from 2 independent experiments). f,g Representative images of FOS expression in the vomeronasal pathway after interaction with PBS- or LPS-females (f) and fold change in the number of FOS-expressing neurons normalized to the mean of the PBS-female group for each region (g) (PBS, n=8 and LPS, n=8; from 2 independent experiments). Scale bar=200μm. AOBmi: mitral layer of the accessory olfactory bulb, AOBgr: granular layer of the accessory olfactory bulb, BST: bed nucleus of the stria terminalis, MEApd: posterodorsal part of the medial amygdalar nucleus, MEApv: posteroventral part of the medial amygdalar nucleus. h-o, Virus encoding GCaMP6s (AAV1-Syn-GCaMP6s) was targeted to the COApm for fiber photometry recordings. Male mice were sequentially presented with a PBS- or LPS-female in counterbalanced sessions (h). Representative trace of COApm bulk fluorescence signal during interactions with the PBS- (black) or LPS-female (orange) (i). Representative traces (marked as α in (i)) (j, k) and the average mean z-score of the fluorescence during direct investigation of the PBS- or LPS-female (l). Spearman’s correlation between mean z-score during investigation and mounting time. Data are pulled from the sessions with PBS- and LPS-females (m). Representative trace (marked as β in (i)) (n) and the average mean z-score of the fluorescence during mounting of the PBS- or LPS-female (o) (n=6 from 3 independent experiments). *P<0.05, **P<0.01, ***P<0.001 and ****P<0.0001 calculated by Chi-Square Test of Independence (b), unpaired two-tailed t-test (c-e), two-way ANOVA with Sidak’s post-hoc test (g) and paired two-tailed t-test (l). Graphs indicate mean ± s.e.m. p-values are described in the supplementary statistical information file.