
Extended Data Figure 8. Summary of gene expression profiling in COApm neurons projecting to MEA-Vglut2(+) neurons.
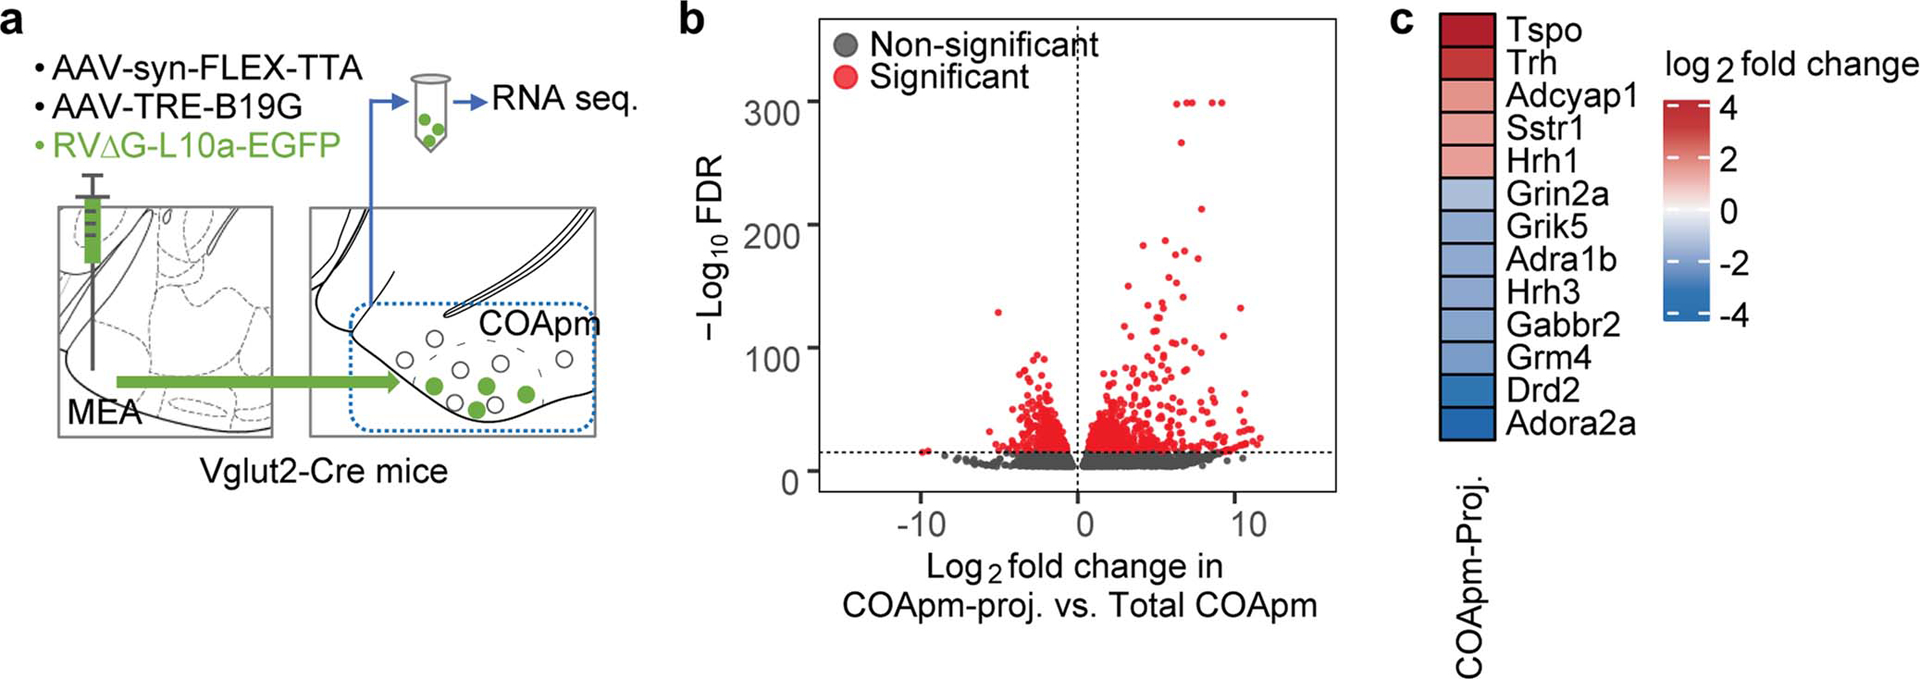
a, A combination of AAV1-syn-FLEX-TTA and AAV-TRE-B19G, and RVΔG-L10a-EGFP were sequentially injected into the MEA of Vglut2-Cre mice to label COApm neurons projecting to MEA-Vglut2(+) neurons (COApm-proj). COApm tissue was harvested and immediately used for TRAP analyses. Control mice were injected with AAV.PHP.eB-Syn-L10a-EGFP via retro-orbital injection in order to label COApm neurons with L10a-EGFP independently of their efferent projections (Total COApm). b, Volcano plot showing log2-fold change plotted against −log10 FDR for the labeled COApm neurons projecting to the MEA-Vglut2(+) population (COApm-Proj.) compared to the Total COApm. Differentially expressed genes that pass the threshold for the FDR are highlighted in red. c, Heatmap showing COApm-differentially expressed genes that belong to the KEGG neuroactive ligand-receptor interaction pathway. p-values are described in the supplementary statistical information file.