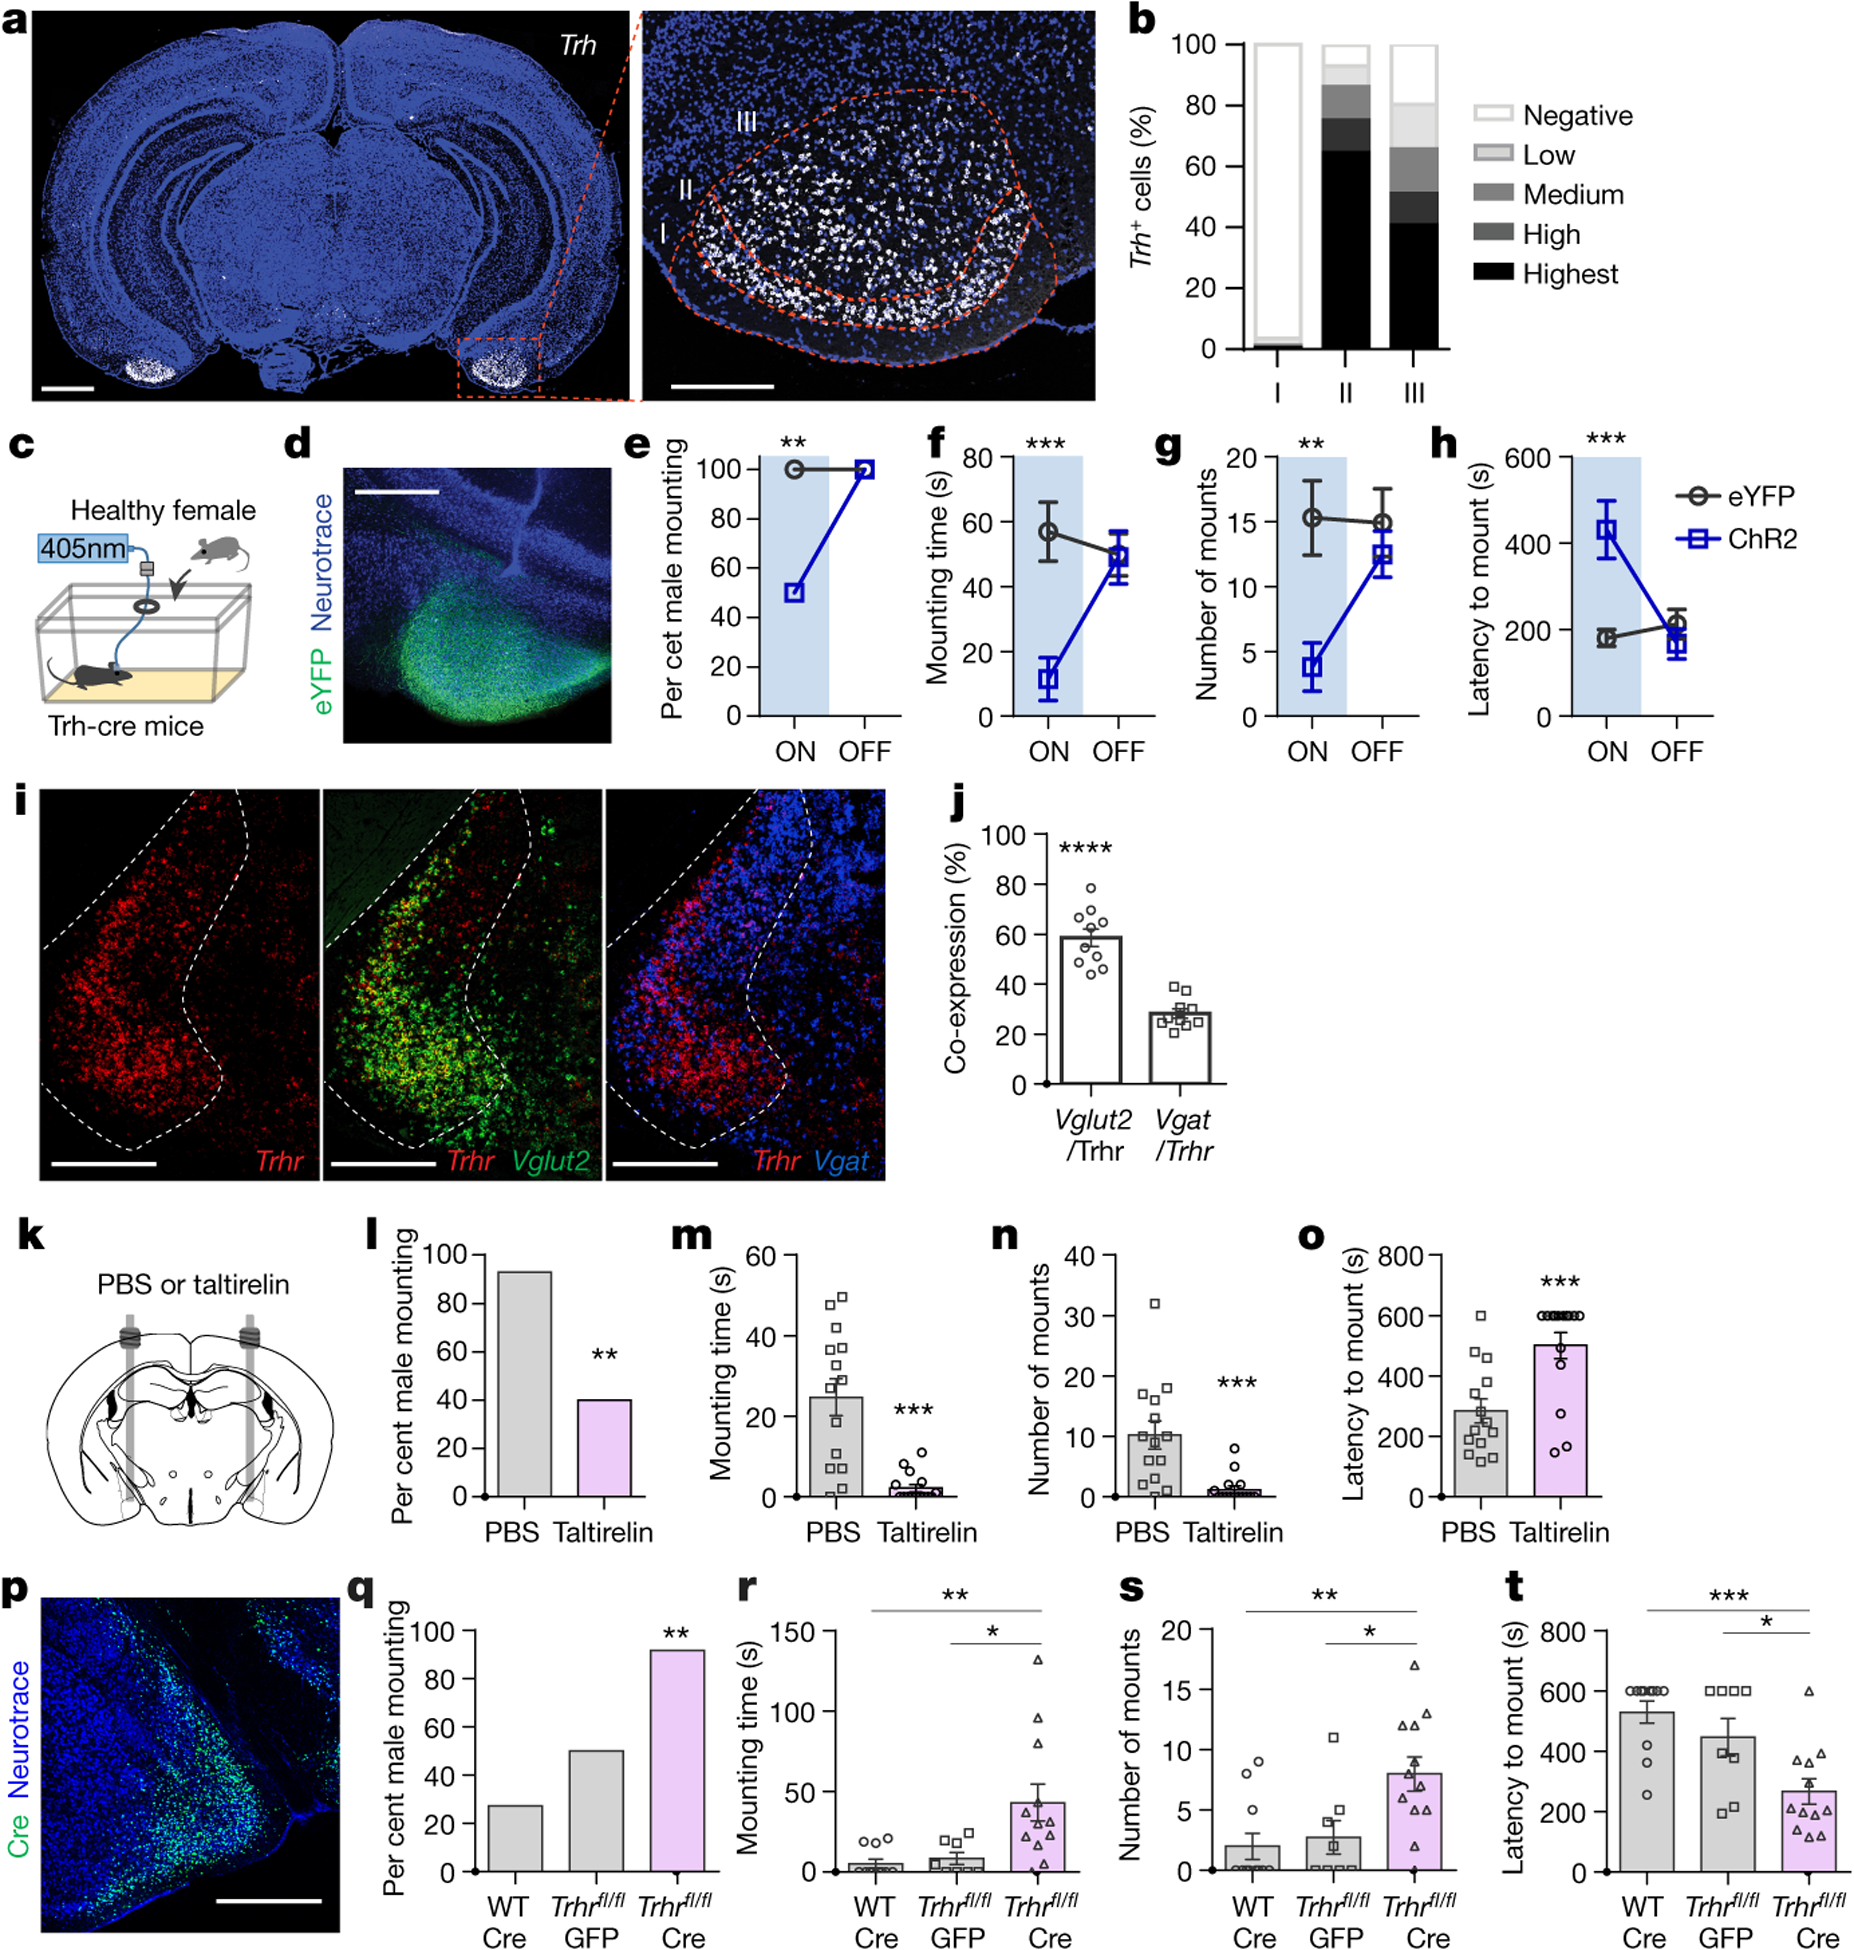
Figure 4. Suppression of social behaviors engages COApm-TRH(+) neurons.

a,b, Representative image (a) and quantification (b) of Trh mRNA expression in wild-type mice at anterior-posterior (AP) −2.9 mm according to cortical layers (n=13 sections from 4 mice; from 2 independent experiments). Dotted line defines cortical layers I, II, and III. Scale bar=1mm (left) and 300μm (right). c-h, Trh-Cre male mice expressing EYFP (AAV2-hSyn-DIO-EYFP) or ChR2 (AAV2-hSyn-DIO-hChR2-EYFP) in COApm-TRH(+) neurons were tested for mating behaviors towards healthy females in the presence (ON) or absence (OFF) of photoactivation (c). Representative image of ChR2 expression in COApm (d). Percent male mounting (e), mounting time (f), number of mounts (g), and latency to mount (h) (EYFP, n=13 and ChR2, n=10; from 2 independent experiments). Scale bar=500μm. i,j, Representative images (i) and quantification (j) of the overlap between cells expressing Trhr (red), Vglut2 (green) and Vgat (blue) mRNA in MEA of wild-type mice at AP −1.8 mm (n=10 MEA sections from total 5 mice; from 4 independent experiments). Dotted line indicates MEA. Scale bar=500μm. k-o, TRH analog taltirelin was bilaterally injected into MEA (k). Percent male mounting (l), mounting time (m), number of mounts (n), and latency to mount (o) (PBS, n=14 and Taltirelin, n=15; from 2 independent experiments). p-t, Wild-type (WT) or TRHRfl/fl male mice expressing GFP (AAV1-hSyn-GFP) or Cre (AAV1-Syn-Cre) in the MEA were tested for mating behaviors towards LPS-females. Representative image of Cre expression in MEA (p). Percent male mounting (q), mounting time (r), number of mounts (s), and latency to mount (t) (WT:Cre, n=11; TRHRfl/fl:EYFP, n=8 and TRHRfl/fl:Cre, n=12; from 2 independent experiments). Scale bar= 500μm. *P<0.05, **P<0.01, ***P<0.001 and ****P<0.0001 calculated by Chi-Square Test of Independence (e,l,q), two-way repeated measures ANOVA with Bonferroni’s post-hoc test (f-h) and paired two-tailed t-test (j), unpaired two-tailed t-test (m-o) and one-way ANOVA with Bonferroni’s post-hoc test (r-t). Graphs indicate mean ± s.e.m. p-values are described in the supplementary statistical information file.
