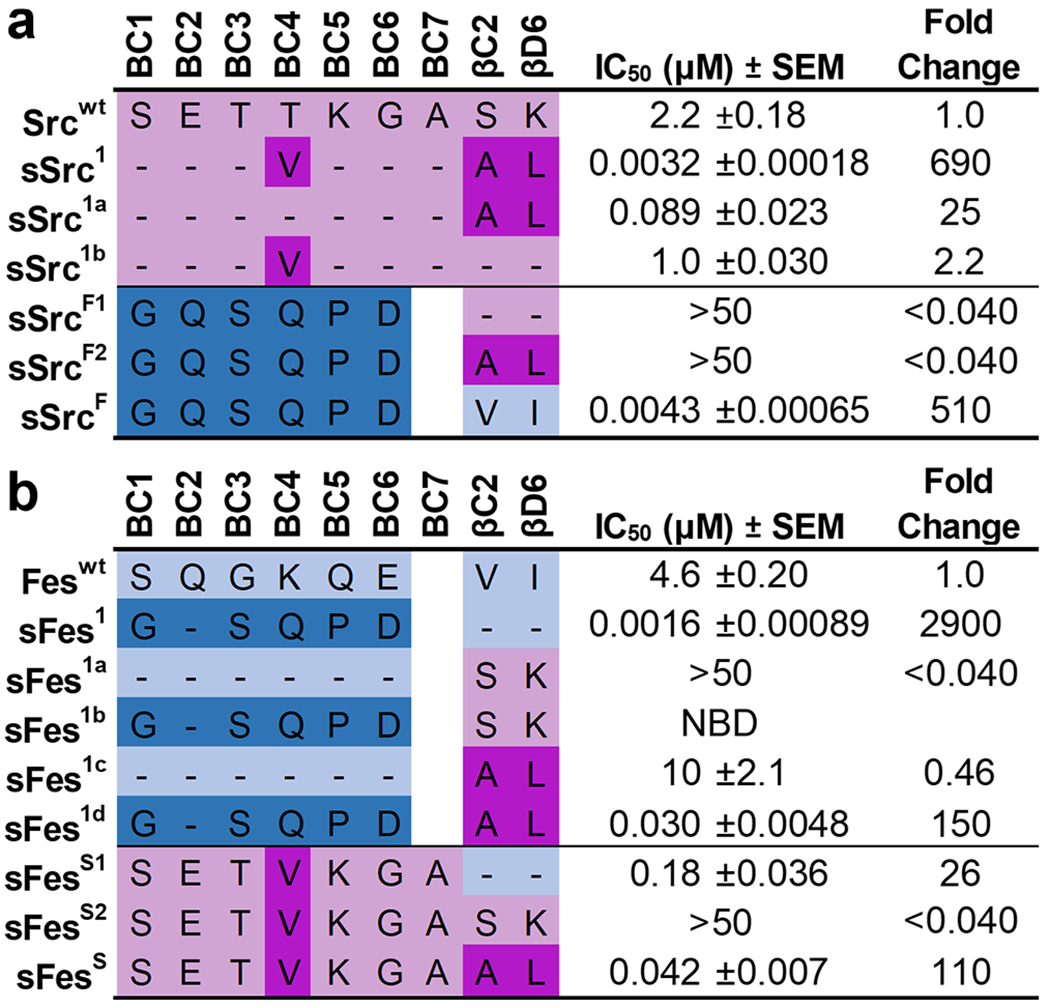
Figure 2.

IC50 values for Src and Fes-SH2 variants binding to phosphopeptides. Schema depicting the different Src-derived and Fes-derived sequences grafted into the (a) Src-SH2 domain or (b) Fes-SH2 domain. Binding to pTyr-peptide pMT (sequence: EEPQpTyrEEIPIY) or pTyr-peptide pEZ (sequence: PPPVpTyrEPVSYH) for Src or Fes variants, respectively, was assayed by competitive SH2 phage ELISAs. The IC50 value was derived from the binding curves, and the fold change relative to the IC50 for the wt domain was calculated. Data are an average of 3 to 4 experimental replicates ± SEM. Sequences derived from Src or Fes are colored pink or blue, respectively, and light or dark colors indicate wt or superbinder sequences, respectively. “NDI” indicates “no detectable inhibition”.
