Figure 5.

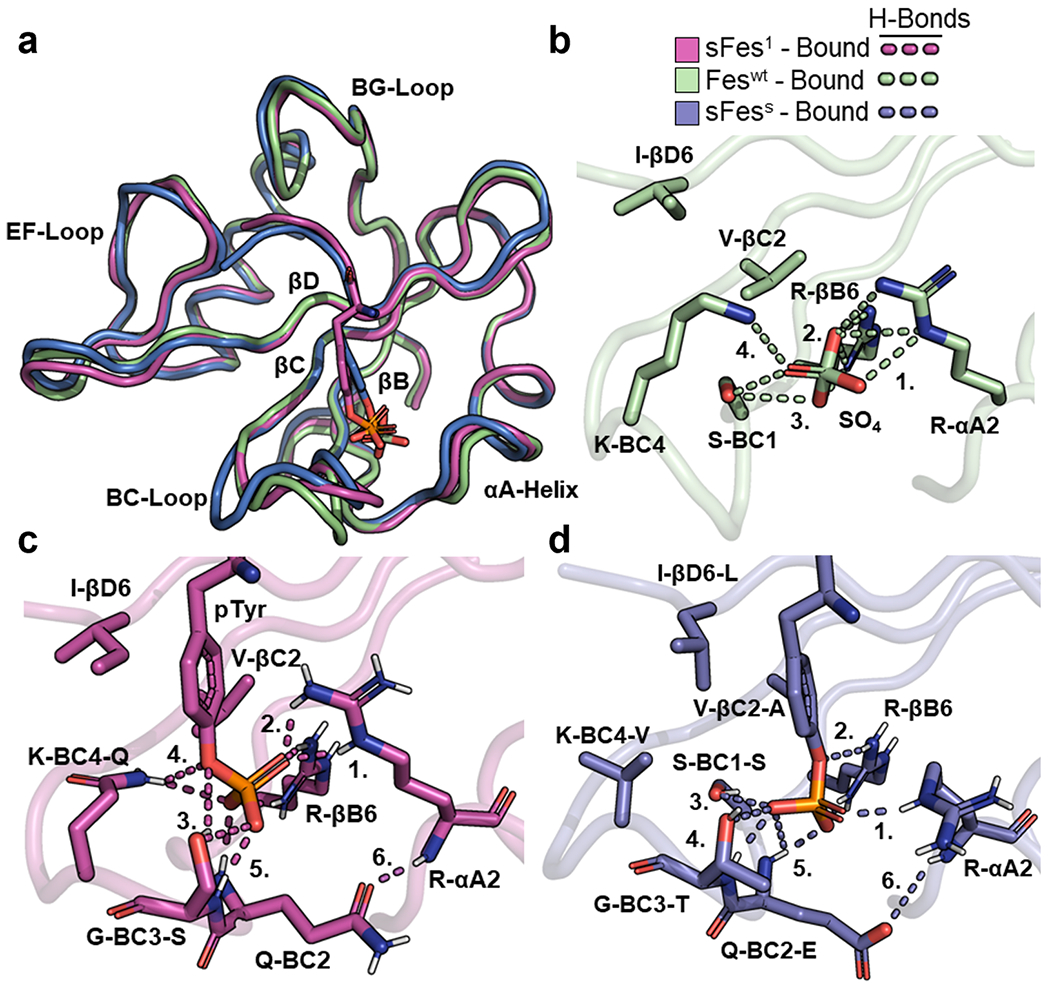
Structural comparison of Fes-SH2 and its variants. (a) Superposition of Fes-SH2 and its variants. The following bound structures are depicted: Feswt (green, PDB ID: 3BKB), sFes1 (magenta), and sFesS (blue). Structures were aligned based on Cα co-ordinates using the ALIGN function in PyMol. (b) pTyr-binding pocket of Feswt (bound). Hydrogen bonds are shown as dashed lines and numbers refer to interactions described in the main text. (c) pTyr-binding pocket of sFes1 (bound). Hydrogen bonds are shown as dashed lines and numbers refer to interactions described in the main text. (d) pTyr-binding pocket of sFesS (bound). Hydrogen bonds are shown as dashed lines and numbers refer to interactions described in the main text.
