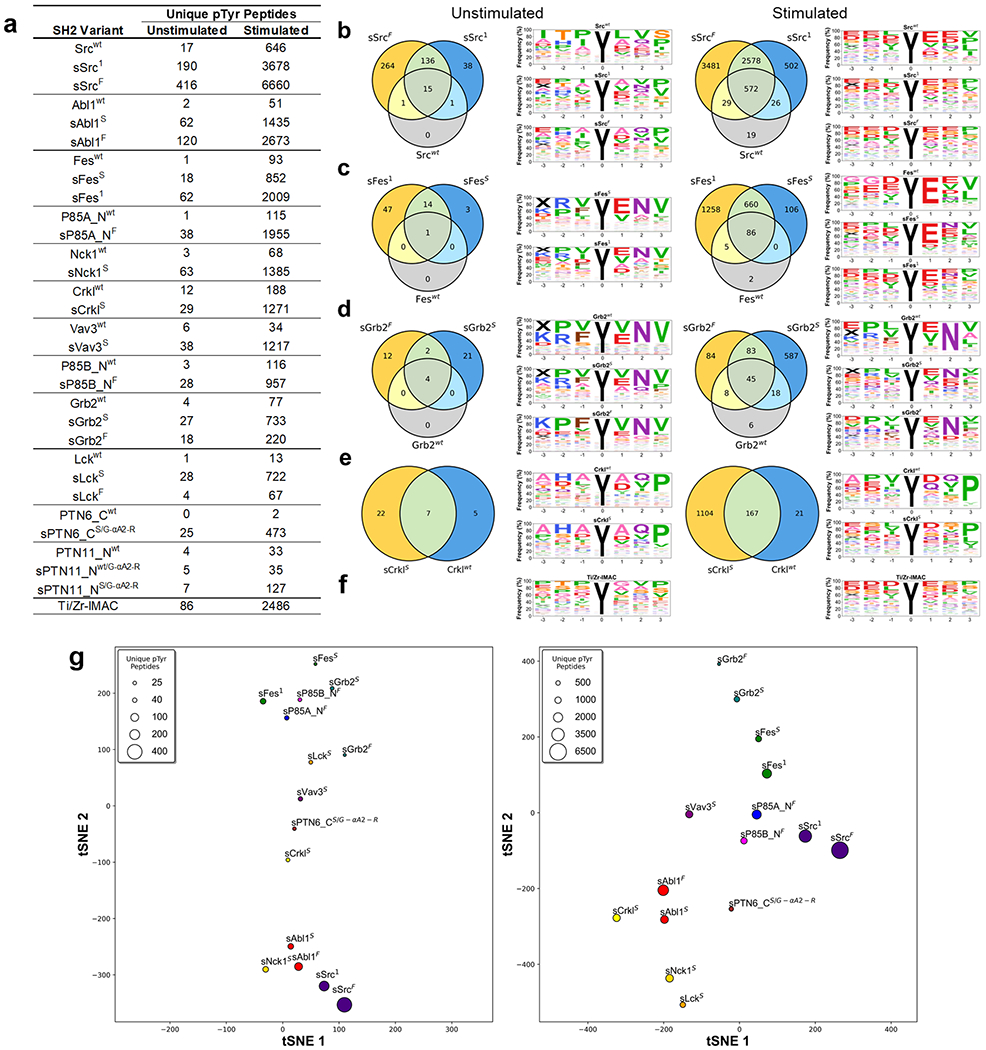
Figure 7.

SH2 variant specificity profiling using AP-MS. (a) Number of unique pTyr-peptides enriched by SH2 variants in AP-MS experiments. SH2 domains are rank-ordered from most unique pTyr-peptides enriched (top) to least (bottom). (b–e) Venn diagrams depicting the number of unique pTyr-peptides and sequence motifs depicting profiles of pTyr-peptides enriched from unstimulated and stimulated K562 cell lysates by (b) Src, (c) Fes, (d) Grb2, or (e) Crkl-SH2 domain variants. (f) Sequence motifs of Ti/Zr-IMAC pTyr-peptide enrichments. (g) t-distributed stochastic neighbor embedding (tSNE) analysis of pTyr-peptide enrichment profiles for superbinders from unstimulated (left) or stimulated (right) K562 cell lysates. Relationships in the plot are qualitative with respect to pTyr-peptide enrichment similarities. The marker size is indicative of the number of unique pTyr-peptides enriched.
