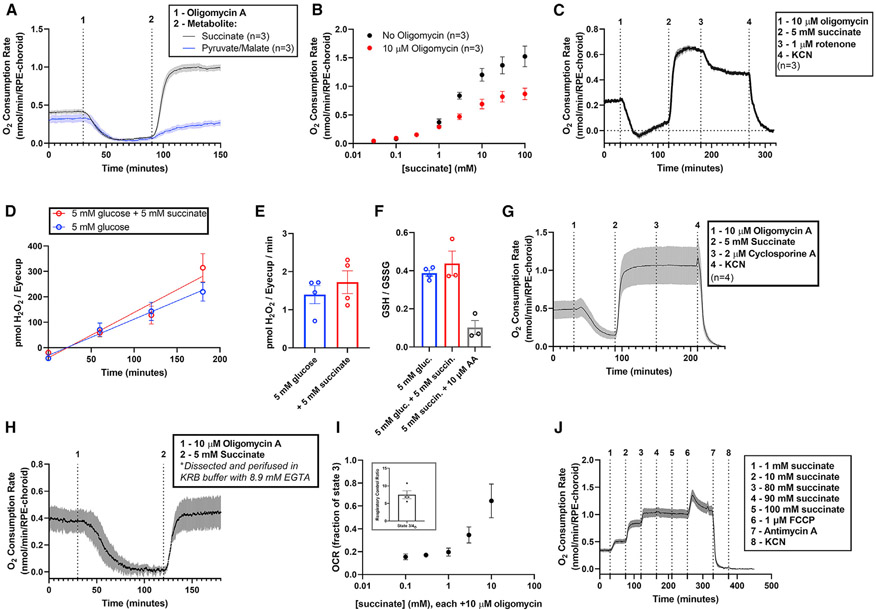
Figure 4. Extracellular succinate is a substrate for and uncoupler of RPE-choroid mitochondria.
(A) We determined ATP synthase-independent substrate oxidation by incubating RPE-choroid tissue in 5 mM glucose, then in 5 mM glucose with 10 μM of the ATP synthase inhibitor oligomycin, and finally in a mix of 5 mM glucose, 10 μM oligomycin, and 5 mM of succinate (black) or pyruvate/malate (blue) (n = 3). 10 μM oligomycin is sufficient to maximize its effect on metabolism (Figure S4).
(B) We determined OCR as a function of [succinate] in the presence or absence of 10 μM oligomycin A (n = 3).
(C) To determine whether NADH oxidation was the source of uncoupled respiration, we first stimulated succinate-dependent uncoupling as in (A), then added 1 μM of the complex I inhibitor rotenone (n = 3). This partially inhibited respiration, suggesting that succinate re-actives NADH oxidation after oligomycin shuts it down.
(D–I) We next determined the effect of succinate on the generation of reactive oxygen species by probing (D–E) H2O2 generation rate (n = 4) and (F) glutathione redox status (n = 3–4). 5 mM succinate did not alter these parameters, so it is unlikely a source of significant ROS in RPE-choroid. To determine the source of oligomycin-resistant respiration, we performed the treatments described in (A), but following the addition of 5 mM succinate, we attempted to shut down the succinate-dependent increase in OCR by adding (G) the mitochondrial permeability transition pore complex inhibitor cyclosporine A (n = 4) or (H) EGTA to deplete perifusion medium of free Ca2+ during the experiment (n = 4). We determined OCR in isolated brain mitochondria using an Oroboros O2K high-resolution respirometer and determined (I, inset) state 3/state 4O OCR and (I) oligomycin-resistant OCR as a function of [succinate] (from 0.1 to 10 mM; n = 4).
(J) We also determined respiration with saturating concentrations of succinate (80–100 mM) and whether OCR could be increased by addition of FCCP. FCCP does increase respiration, suggesting that in RPE-choroid, succinate is not fully uncoupling all mitochondria (n = 4). Data are represented as mean ± SEM. (E), (F), and the inset of (I) also show values from individual replicates. See also Figures S4-S6.

