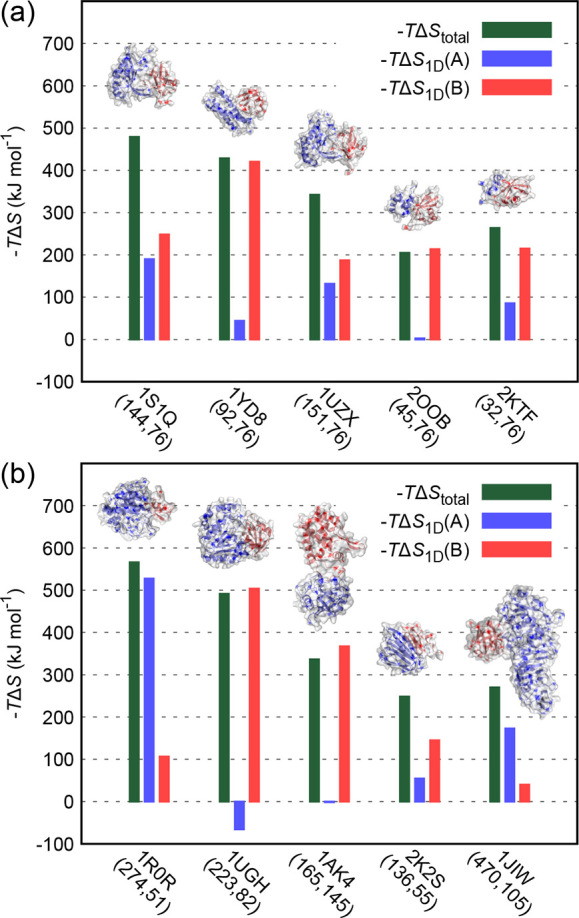
Figure 1.

Structures of the simulated protein complexes together with the computed configurational entropy contributions to the Gibb’s free energy change of binding of the whole complexes (−TΔStotal) or binding partners alone [−TΔS1D(A) and – TΔS1D(B)]. The latter values stem from the internal degrees of freedom of individual binding partners without any coupling (mutual information) contributions included. On the x-axis, we give the PDB code41,42 of each complex together with the number of amino acids in each partner (in parentheses). In (a), the second binding partner B (colored red) is always ubiquitin. Please see Table 1 for further details concerning the simulated complexes.
