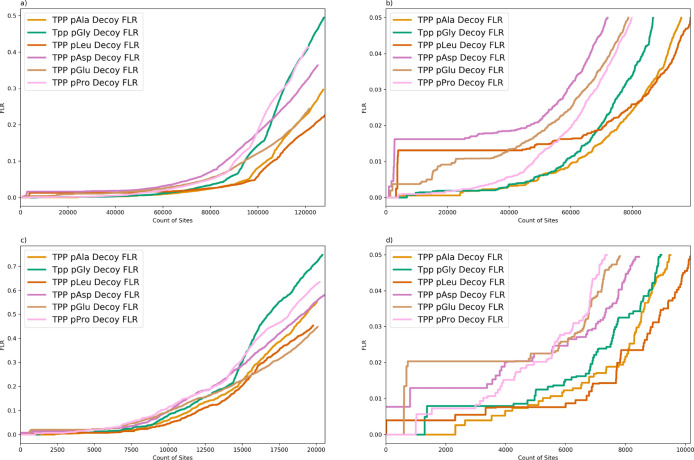
Figure 4.
Comparison of decoy FLR estimation searching PXD000612 (human data set) using different decoy amino acids: pAla, pGly, pLeu, pAsy, pGlu, and pPro (TPP, fully tryptic, 1 % FDR). (a) no collapse, all sites shown; (b) zoom on 5% FLR; (c) collapse to unique sites; (d) zoom on <5 FLR for data collapsed to unique sites. X-axis is count of sites, y-axis is global FLR, estimated as q-values by the decoy method.

