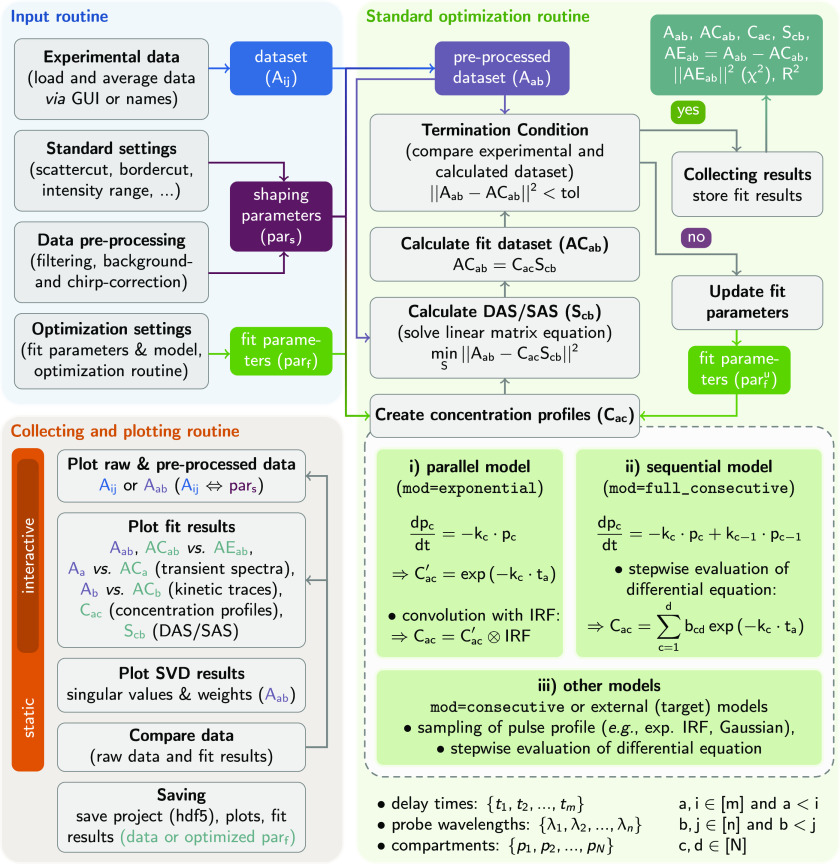
Figure 2.
Schematic representation of the processing structure and the three main workflow routines, i.e., the input (blue box) and standard optimization (green box), as well as collecting and plotting routines (orange box) KiMoPack. Individual operations (functions) and their returns are indicated by bright gray and colored boxes, respectively.

