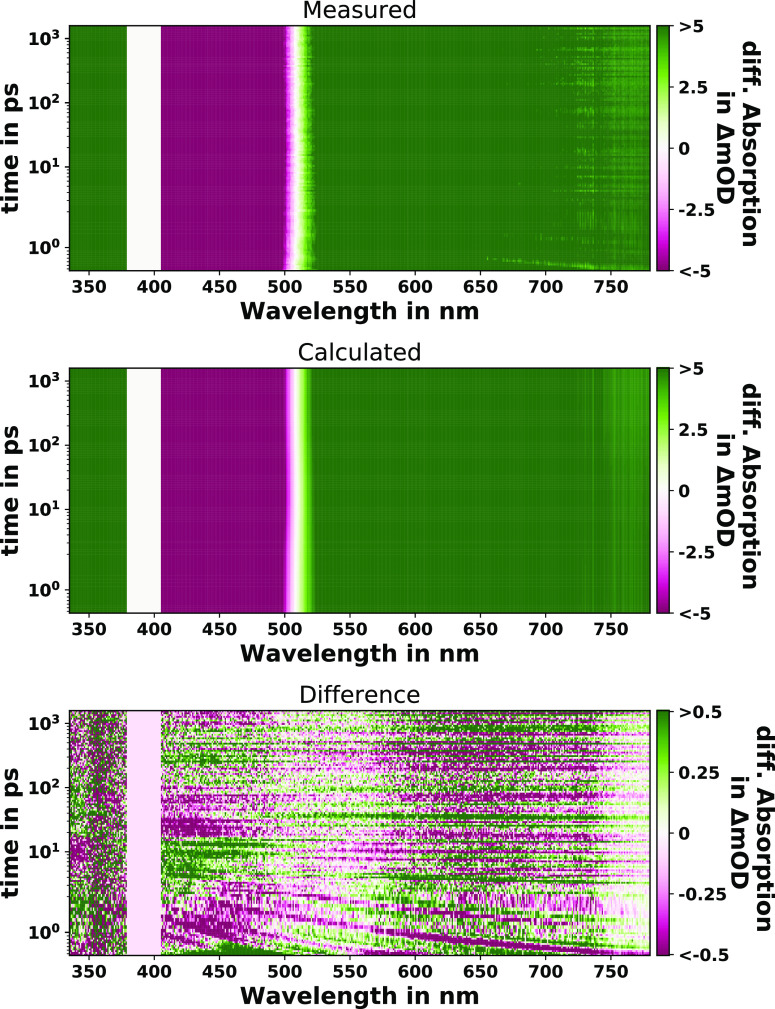
Figure 5.
Contour plots of the preprocessed (measured: Aab) and modeled (calculated: ACab) fs-TA data of Ru-dppz in acetonitrile (ACN) in the time-delay range of 350 fs to 1800 ps and probe wavelength range of 330 to 780 nm upon photoexcitation at 400 nm. The bottom plot shows the 10-fold amplified difference of the measured and calculated data (AEab) enabling an inspection of the overall fit quality.

