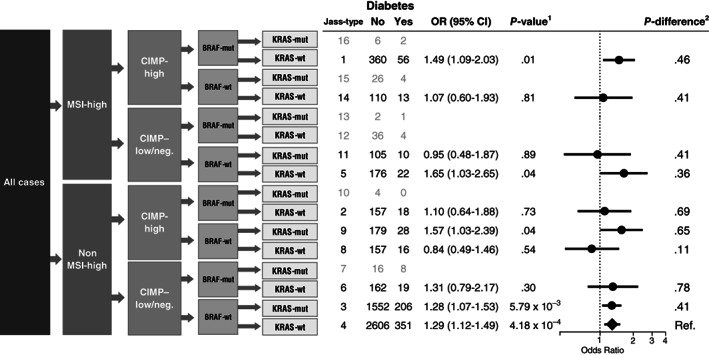
FIGURE 1.

Case‐control associations between individuals reporting diabetes and individuals not reporting diabetes with risk of colorectal cancer subtypes defined by combined marker status. Error bars represent 95% confidence intervals. Adjusted for: study, sex, age at crc diagnosis, energy intake, family history, BMI, red meat, processed meat, vegetables, fruit, alcohol, smoking, exercise and aspirin/NSAID use. 1 P‐values were calculated using multinomial logistic regression, comparing colorectal cancer cases to cancer free controls separately for each defined Jass‐type with more than 50 cases included. 2 P difference was calculated using multinomial logistic regression, comparing cases of each Jass‐type to all additional cases not belonging to that type
