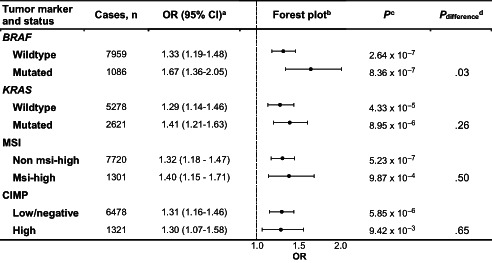
TABLE 2.
Associations between diabetes and risk of different molecular subtypes of colorectal cancer

|
Adjusted for: study, sex, age at CRC diagnosis, energy intake, family history, BMI, red meat, processed meat, vegetables, fruit, alcohol, smoking, exercise and aspirin/NSAID use.
Error bars represent 95% confidence intervals.
Multinomial logistic regression was used to compare colorectal cancer cases to cancer free controls separately for each molecular pathological subtype (polytomous analysis, P).
Multinomial logistic regression was used to compare cases of each molecular pathological subtype to all additional cases not belonging to that subtype (case only analysis, P difference).
