Figure.

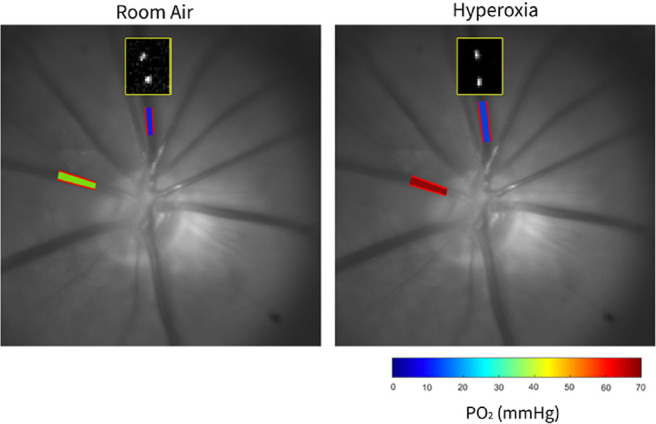
Representation of the method for retinal vascular PO2 and blood flow imaging in the same rat under 30 minutes of BCCAO under RA breathing and under hyperoxia. Yellow-outlined boxes overlaid on the red-free fundus images show the position of intravenous fluorescent microspheres at two time points, depicting similar velocity (distance the microsphere moved during the same time interval). Overlaid on the red-free fundus images are automatically detected retinal vessel boundaries (outlined in red) in a retinal artery and vein, depicting similar arterial and venous diameters between RA and hyperoxia conditions. Retinal arterial and venous PO2 measurements are displayed in pseudo-color. The color bar shows PO2 values in mm Hg. Increased arterial PO2 can be observed under hyperoxia compared to RA.
